The Kafka Connect UI
Learn about the Kafka Connect section in the Streams Messaging Manager UI, which you can use to deploy, manage, and monitor Kafka Connect connectors.
 Connect section in Streams Messaging Manager is your main hub in Cloudera where you deploy, manage,
and monitor Kafka Connect connectors. This section of the UI is only available if you deployed
Kafka Connect role instances under your Kafka service and Streams Messaging Manager is configured to integrate with
Kafka Connect. For detailed instructions on how to set up Kafka Connect and integrate it with
Streams Messaging Manager, see Kafka Connect Setup.
Connect section in Streams Messaging Manager is your main hub in Cloudera where you deploy, manage,
and monitor Kafka Connect connectors. This section of the UI is only available if you deployed
Kafka Connect role instances under your Kafka service and Streams Messaging Manager is configured to integrate with
Kafka Connect. For detailed instructions on how to set up Kafka Connect and integrate it with
Streams Messaging Manager, see Kafka Connect Setup. 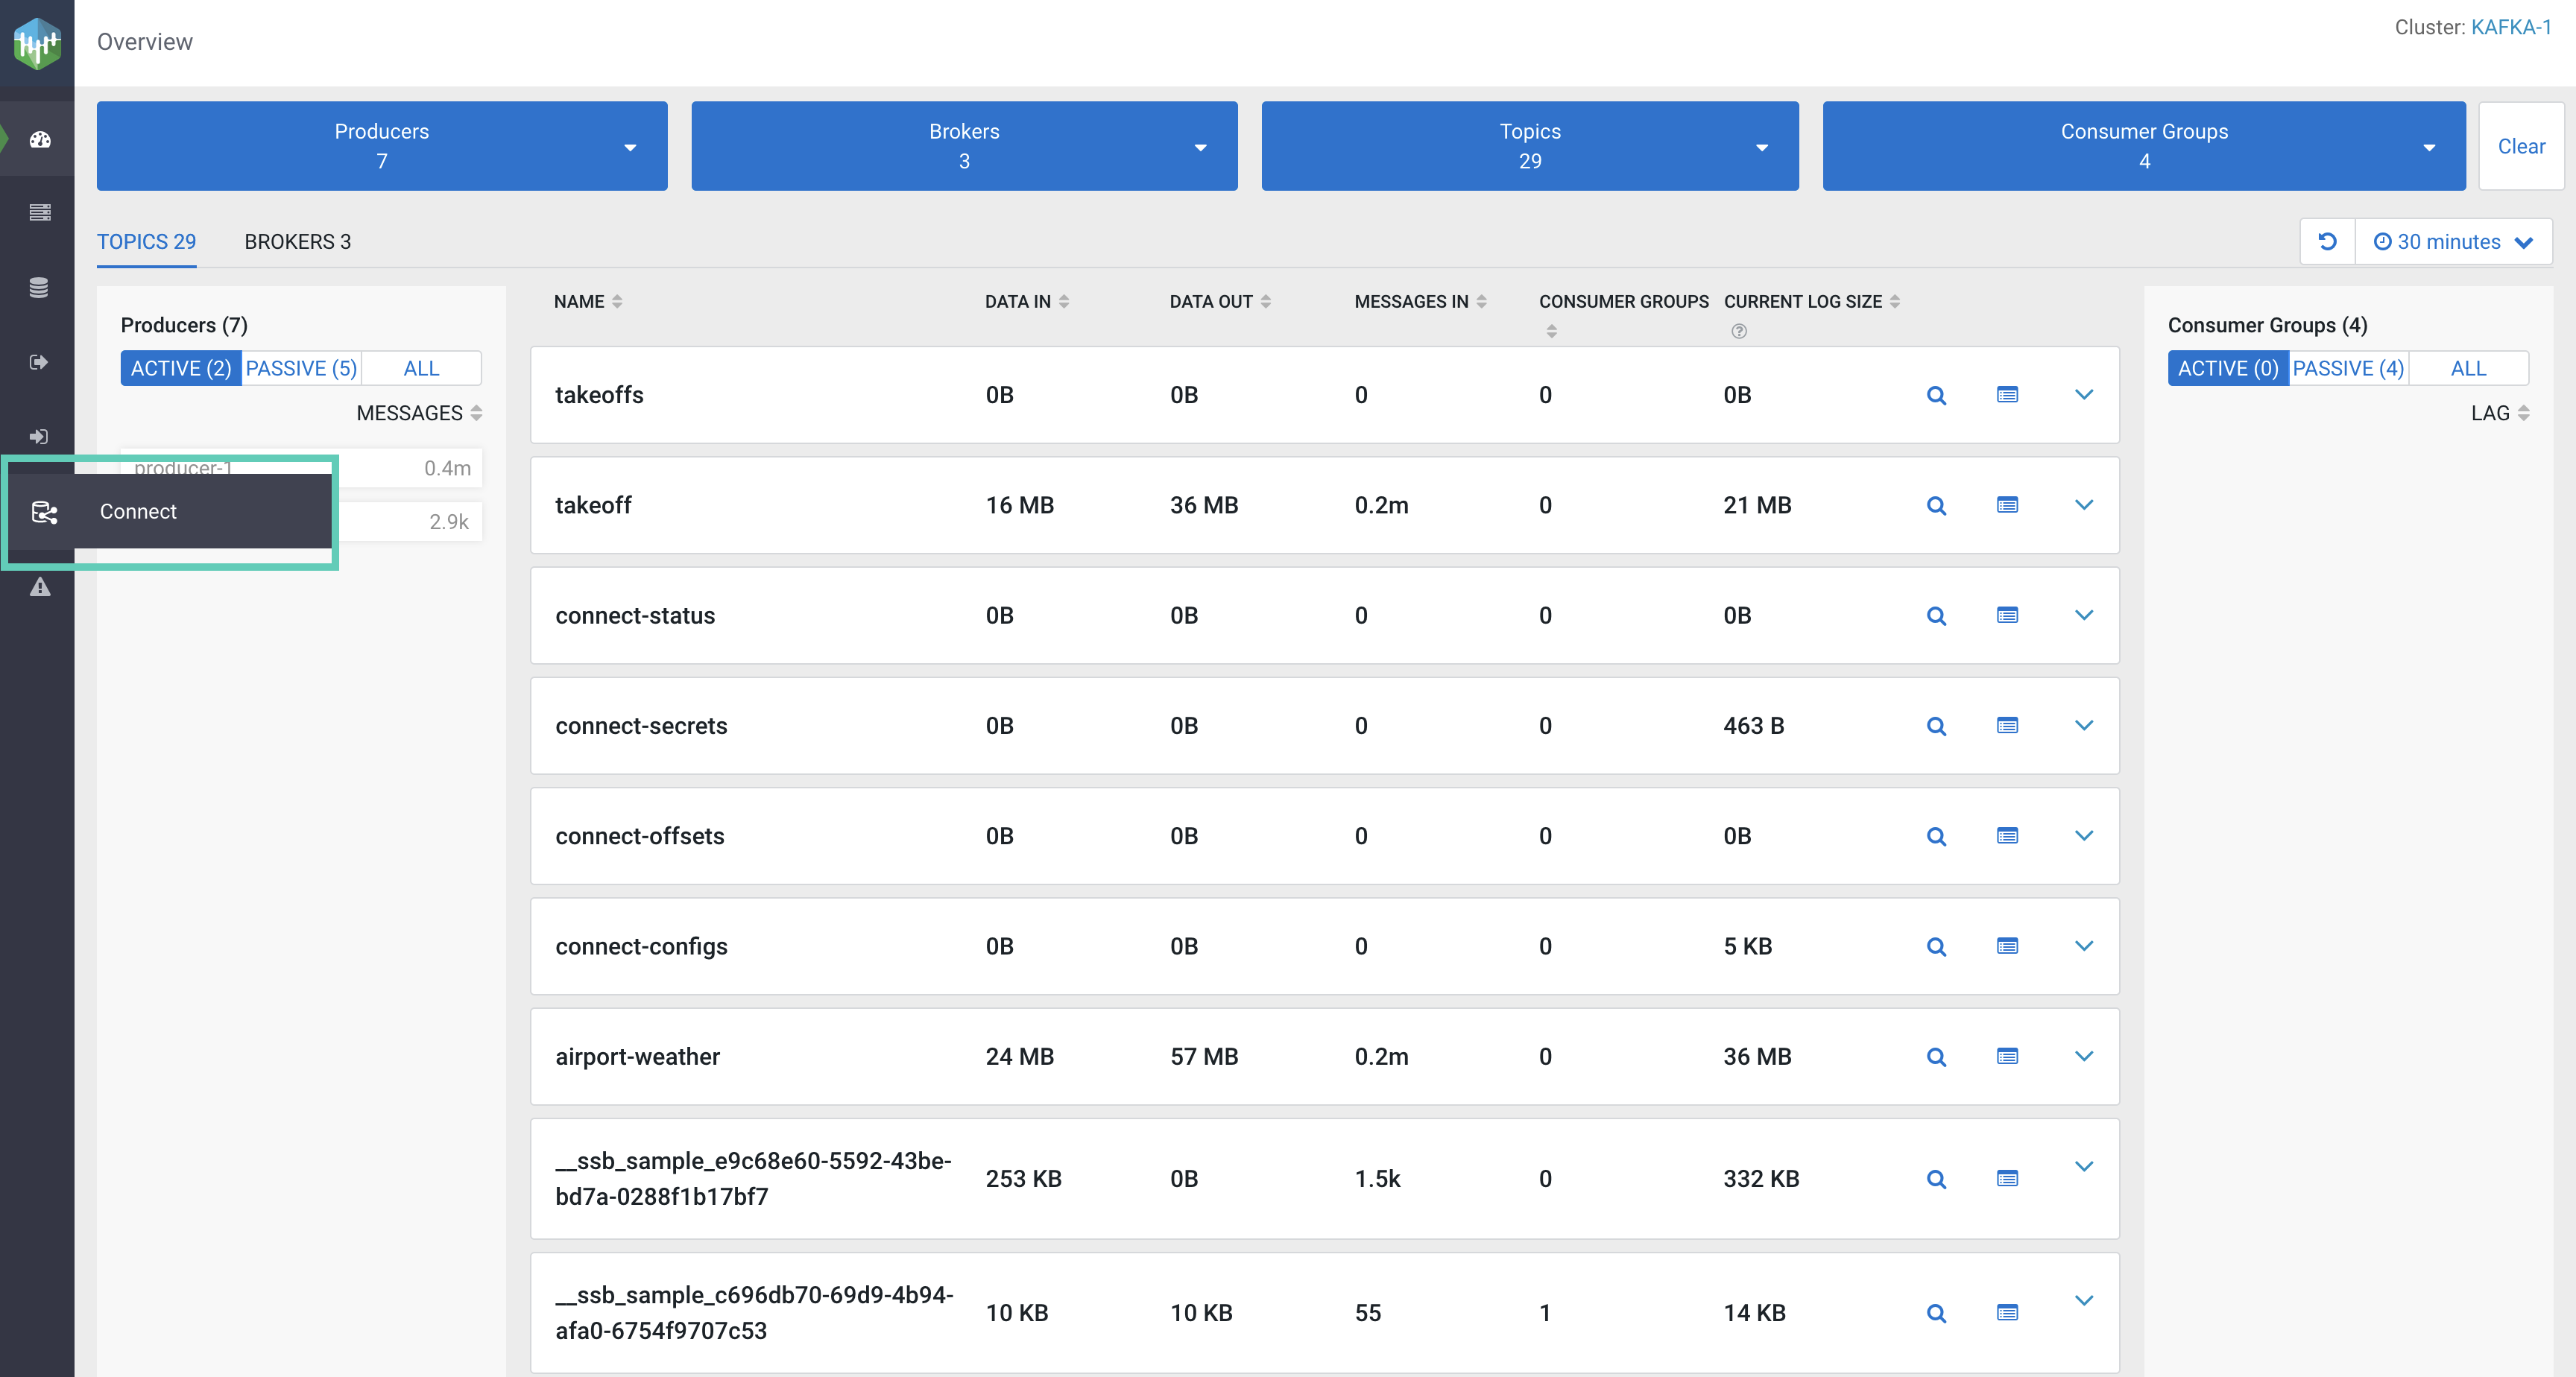
Clicking Connect, opens the Connect
Cluster page with the Connectors tab open. This is the
default page of the Kafka Connect UI. It provides a high level overview of the connectors and
the connect cluster.
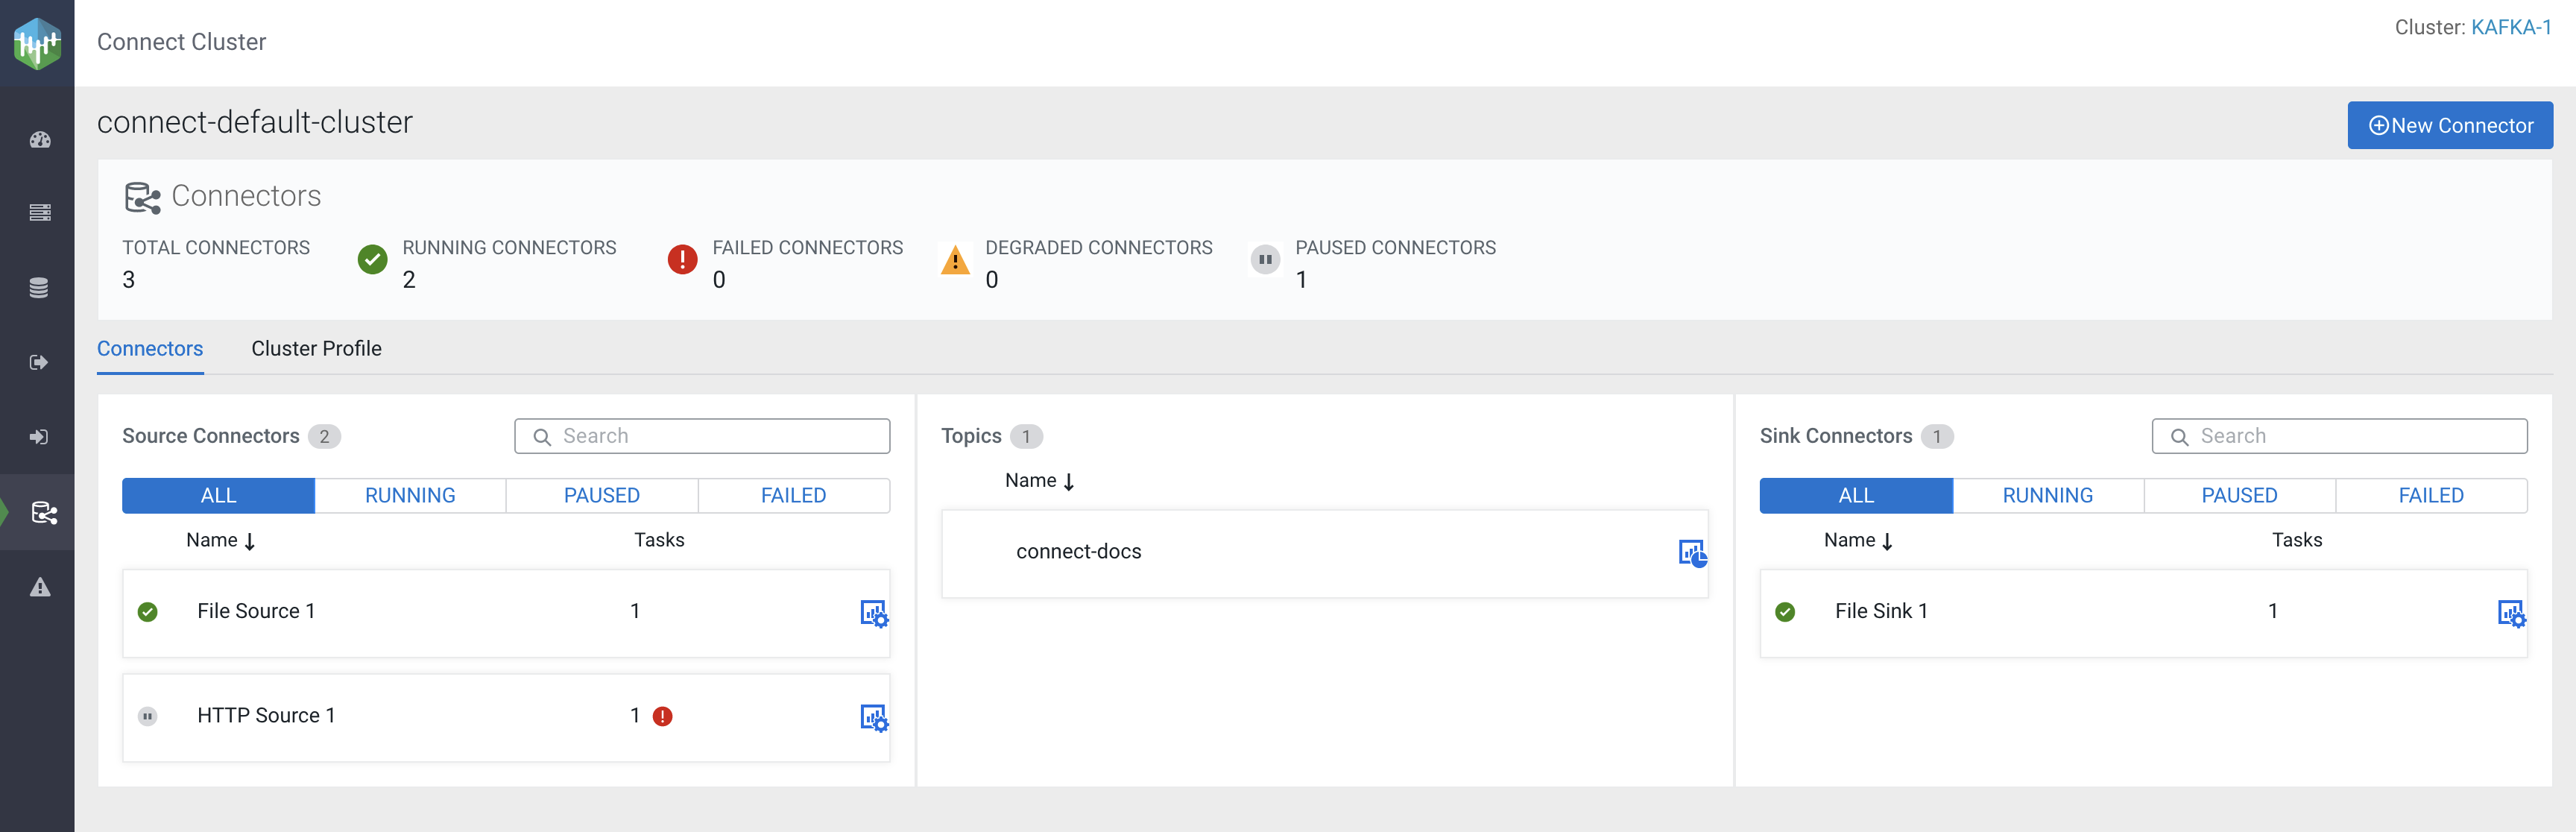
At the top-right corner of the Connect Cluster page, you can see the
name of the cluster. The  New Connector option below the cluster name starts the
Connector Setup wizard, which you use to deploy connectors in your
cluster. For detailed steps on how to deploy a new connector, see Deploying and Managing
connectors .
New Connector option below the cluster name starts the
Connector Setup wizard, which you use to deploy connectors in your
cluster. For detailed steps on how to deploy a new connector, see Deploying and Managing
connectors .
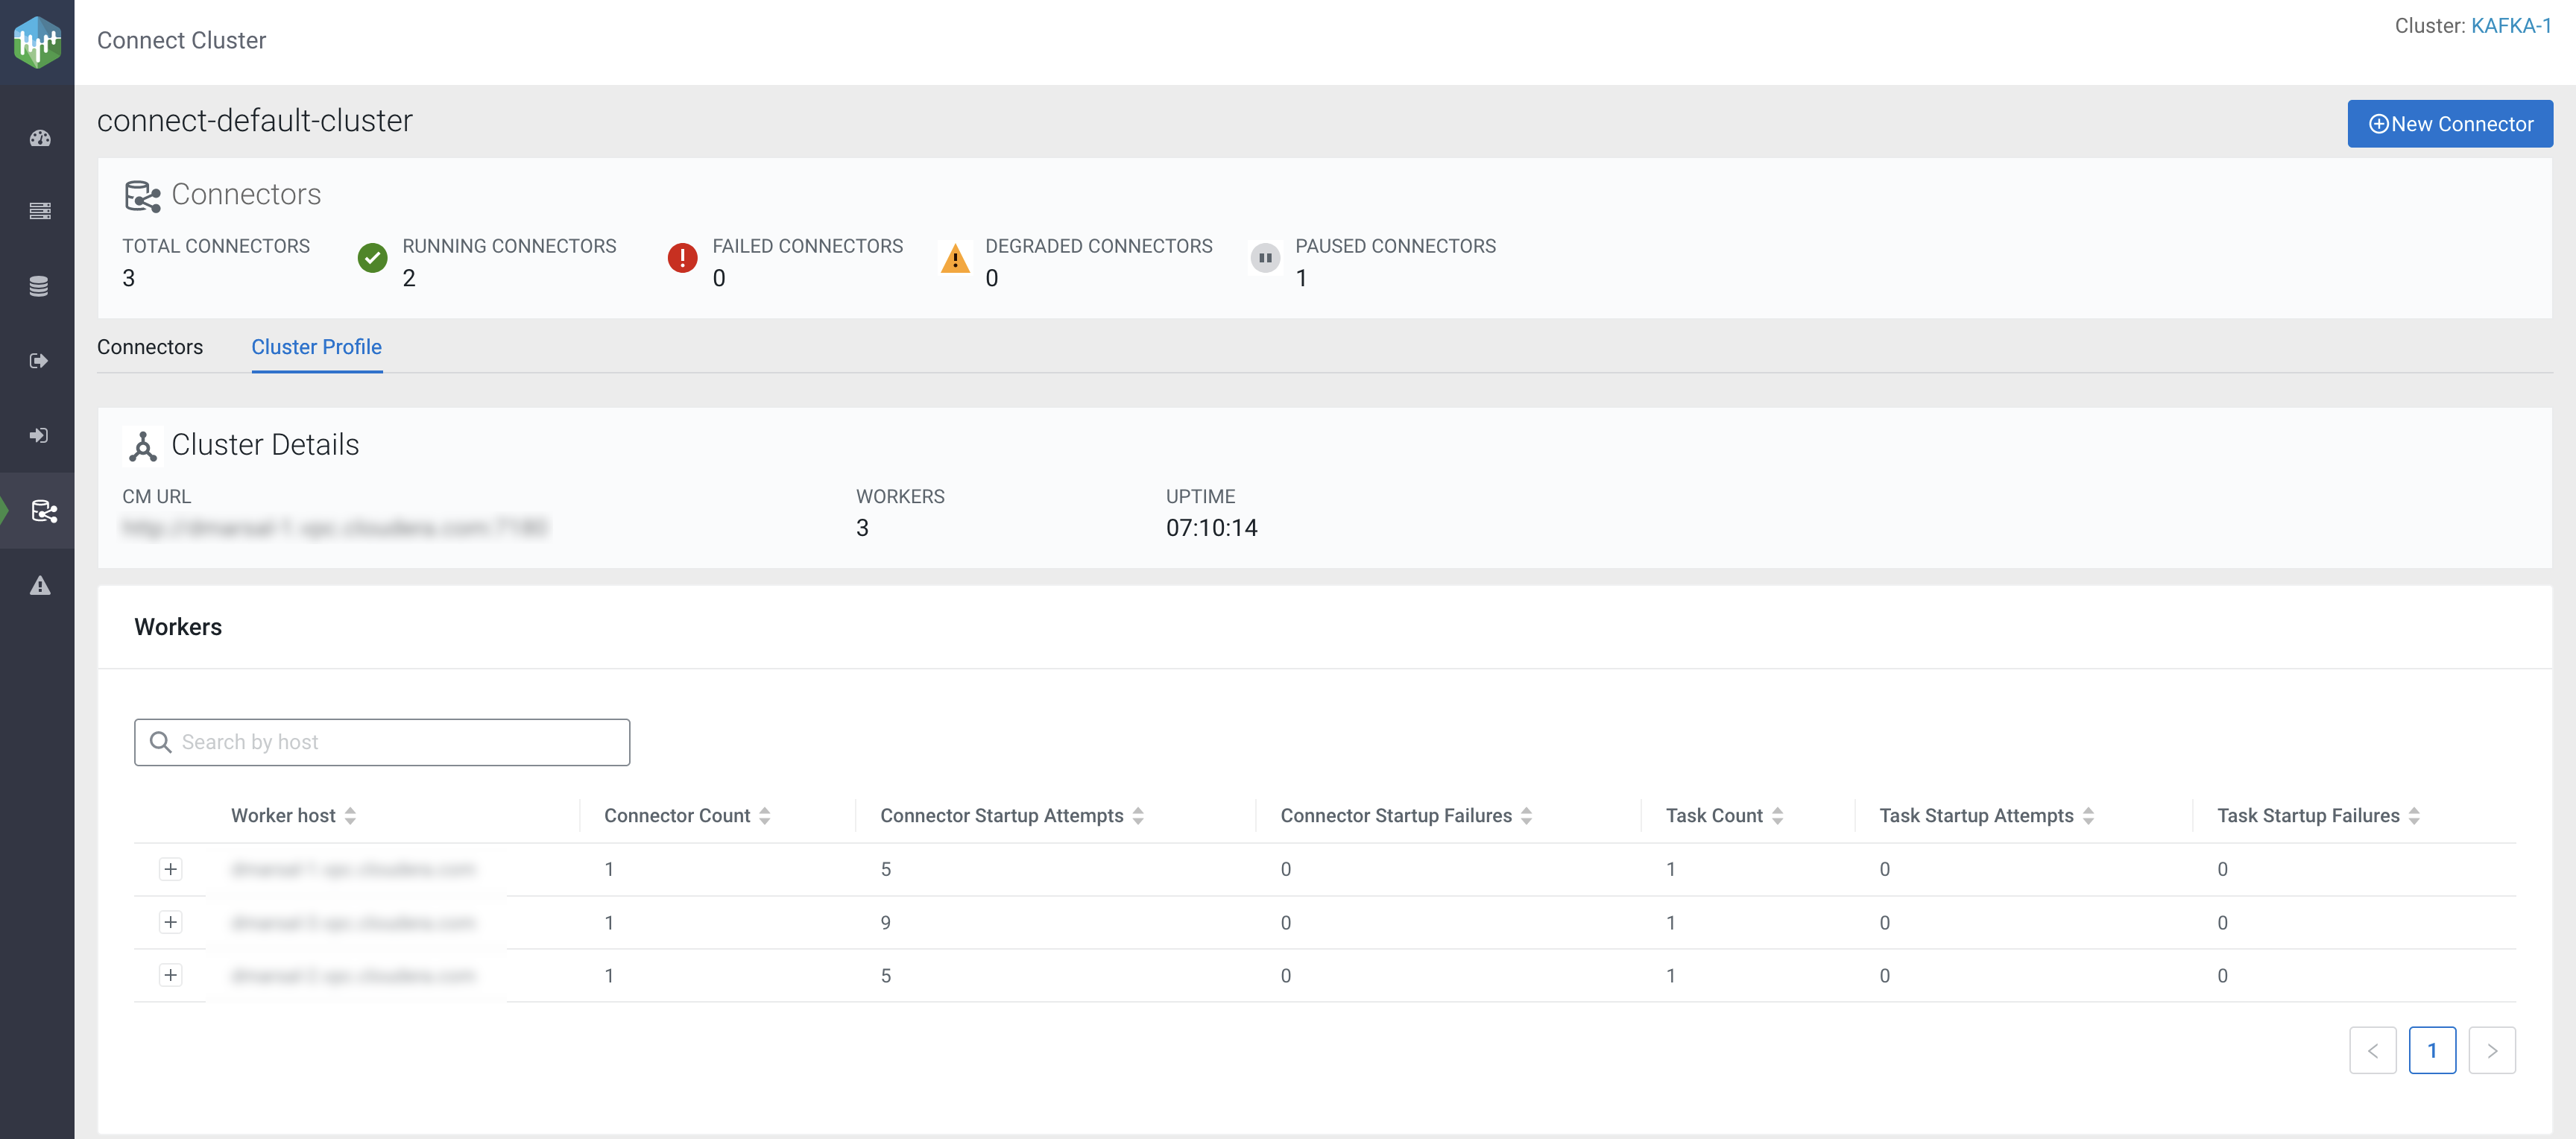
The Connectors section provides some basic metrics regarding Kafka Connect including total connectors, running connectors, failed connectors, degraded connectors, and paused connectors. Under the Connectors section you can find two tabs, Connectors and Cluster Profile. The two tabs enable you to monitor and manage your connectors and the connect cluster.
Connectors tab
In the Connectors tab, you can view details of the source connectors, topics, and sink connectors in the cluster. The Source Connectors and Sink Connectors sections show all, running, paused, and failed connectors with connector name and associated task details. Both Source Connectors and Sink Connectors sections contain a Search option that enables you to search for particular connector details. The Topics section shows the Kafka topics where data is read from or written to.
Cluster Profile tab
In the Cluster Profile tab, you can view details of the connect cluster and the workers. The tab includes information regarding your cluster such as the Cloudera Manager URL, the number of workers deployed in the cluster, as well as an uptime counter. Additionally, the Workers section lists all worker hosts available in the cluster. This section includes basic worker-level information, such as how many connectors are deployed on a worker, success and failure rates, and more.
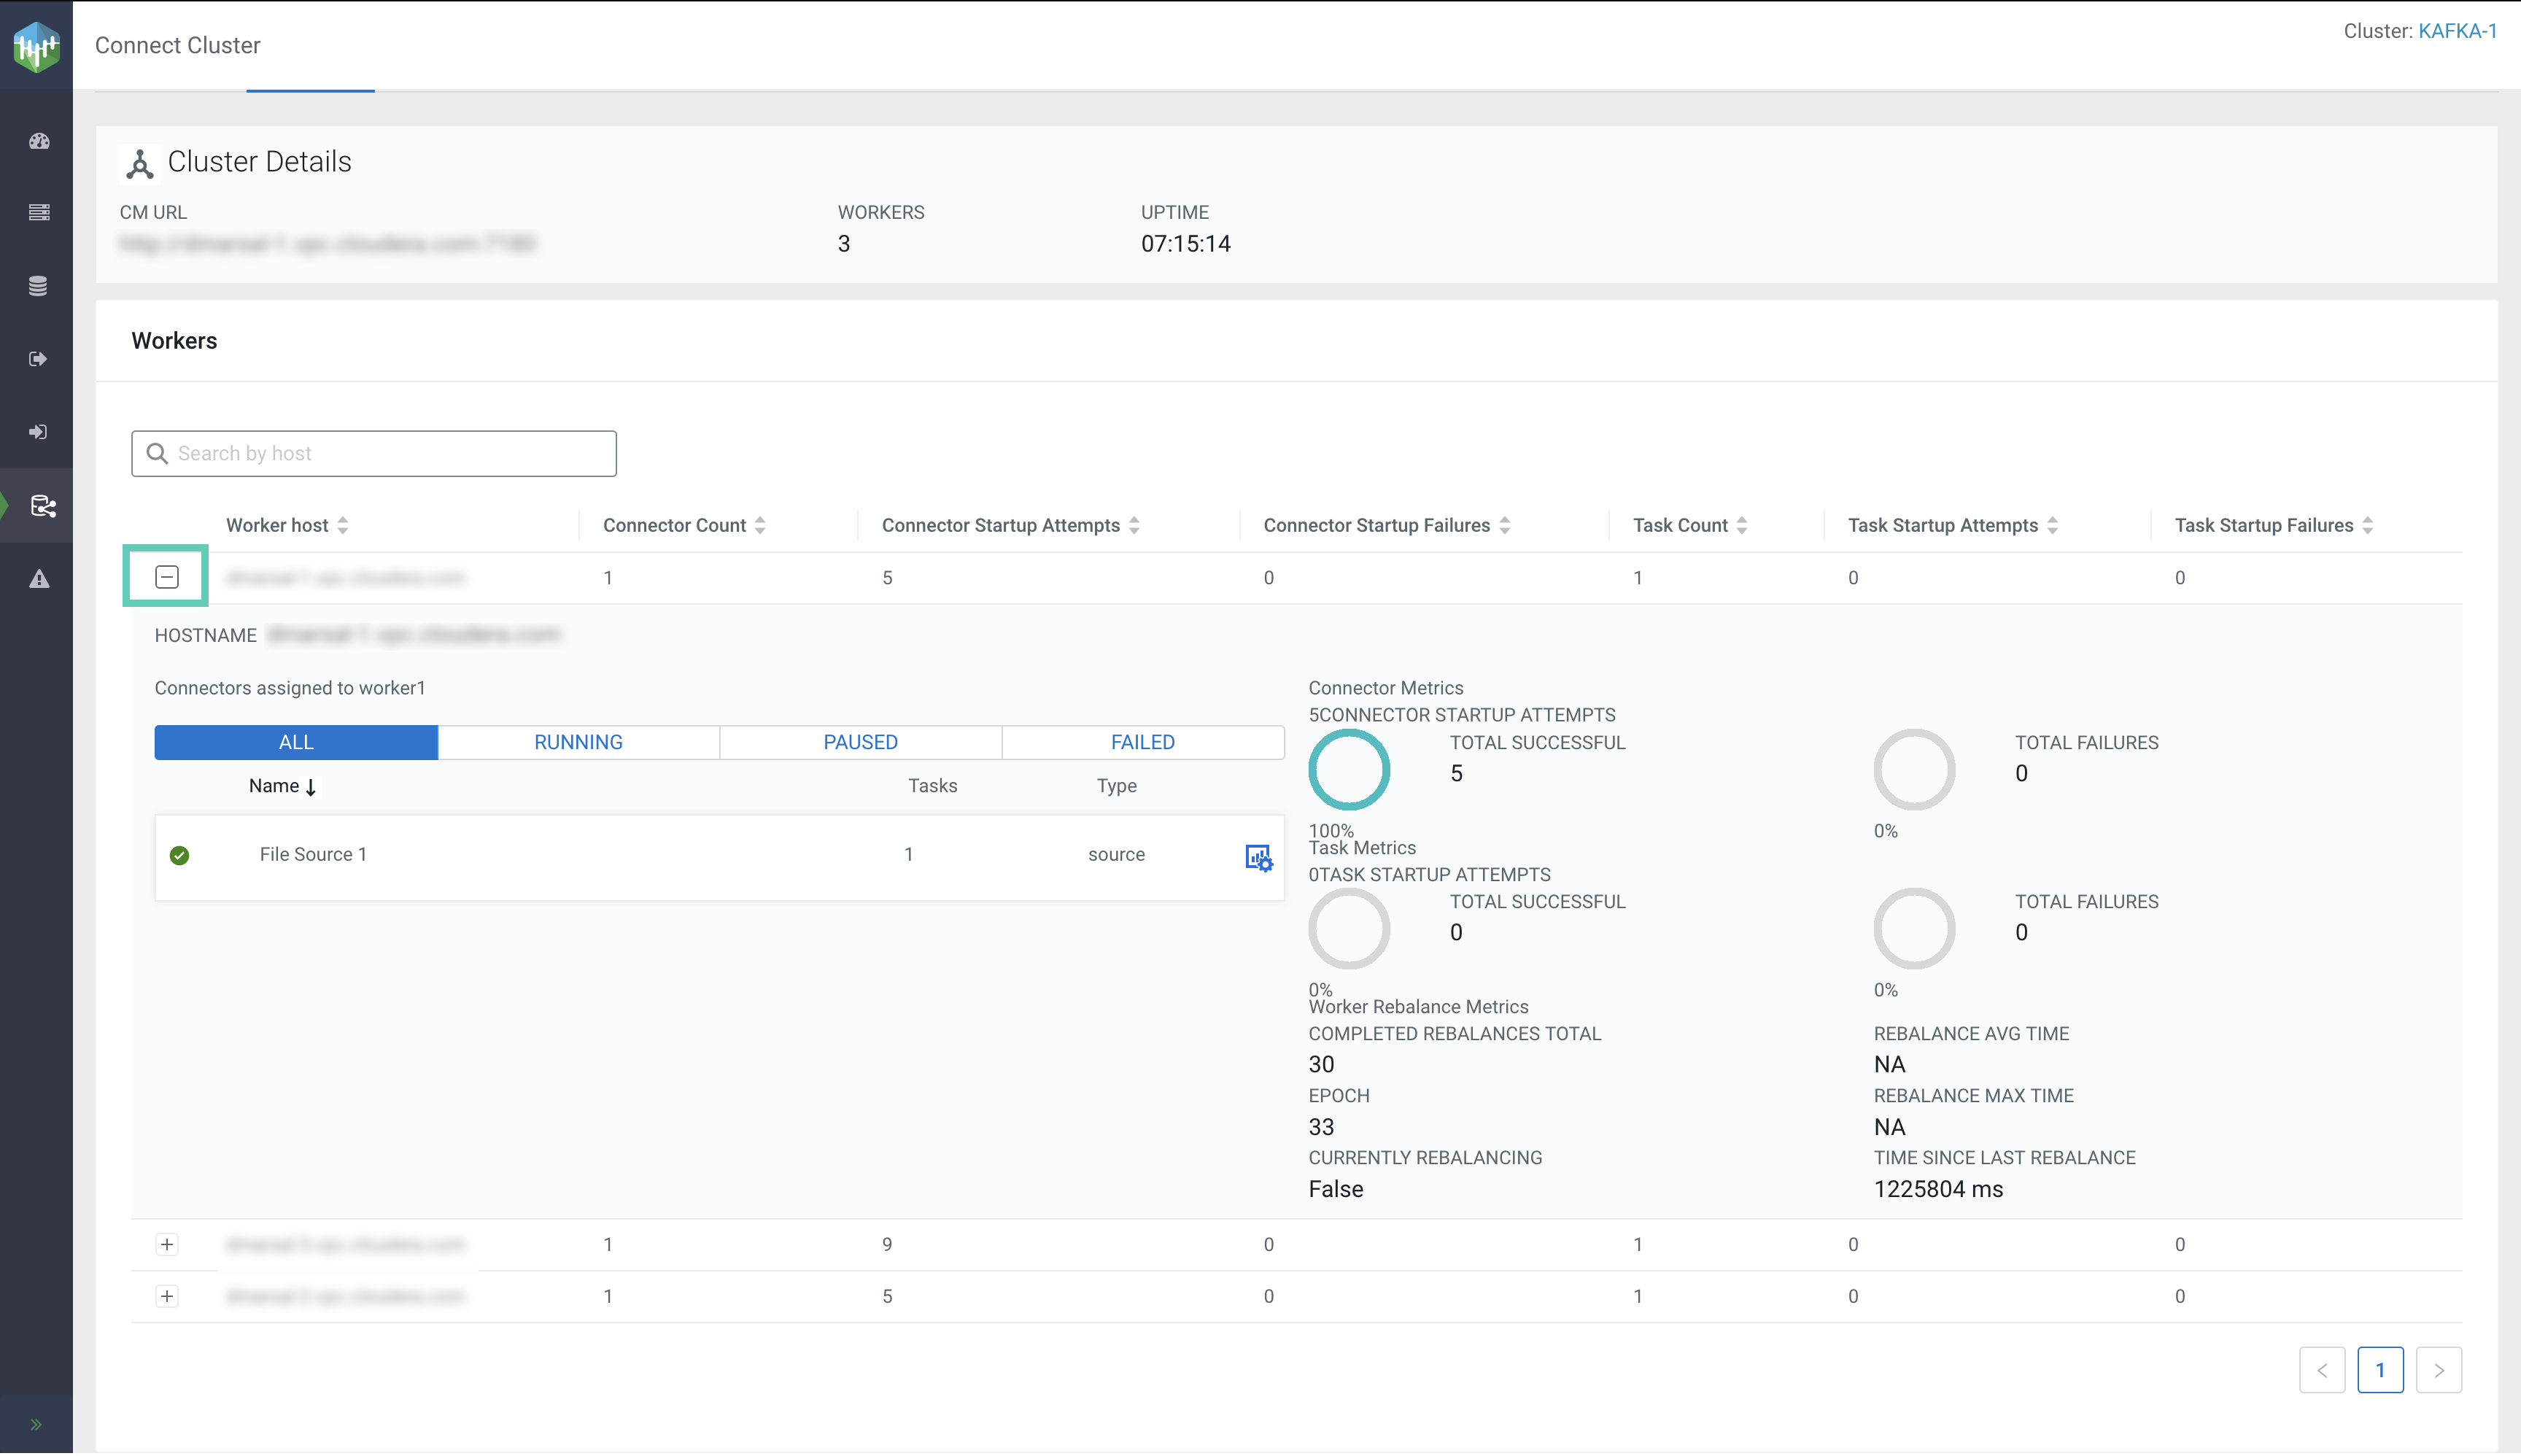
If you click the  option found
next to each host, additional details and metrics are displayed that are specific to the
worker host you selected. The information includes a list of connectors assigned to the
worker, as well detailed connector, task, and worker rebalance metrics. Using the
Search by host field, you can search for worker details by host.
Additionally, you can filter the list of connectors deployed on the worker host based on their
status.
option found
next to each host, additional details and metrics are displayed that are specific to the
worker host you selected. The information includes a list of connectors assigned to the
worker, as well detailed connector, task, and worker rebalance metrics. Using the
Search by host field, you can search for worker details by host.
Additionally, you can filter the list of connectors deployed on the worker host based on their
status.
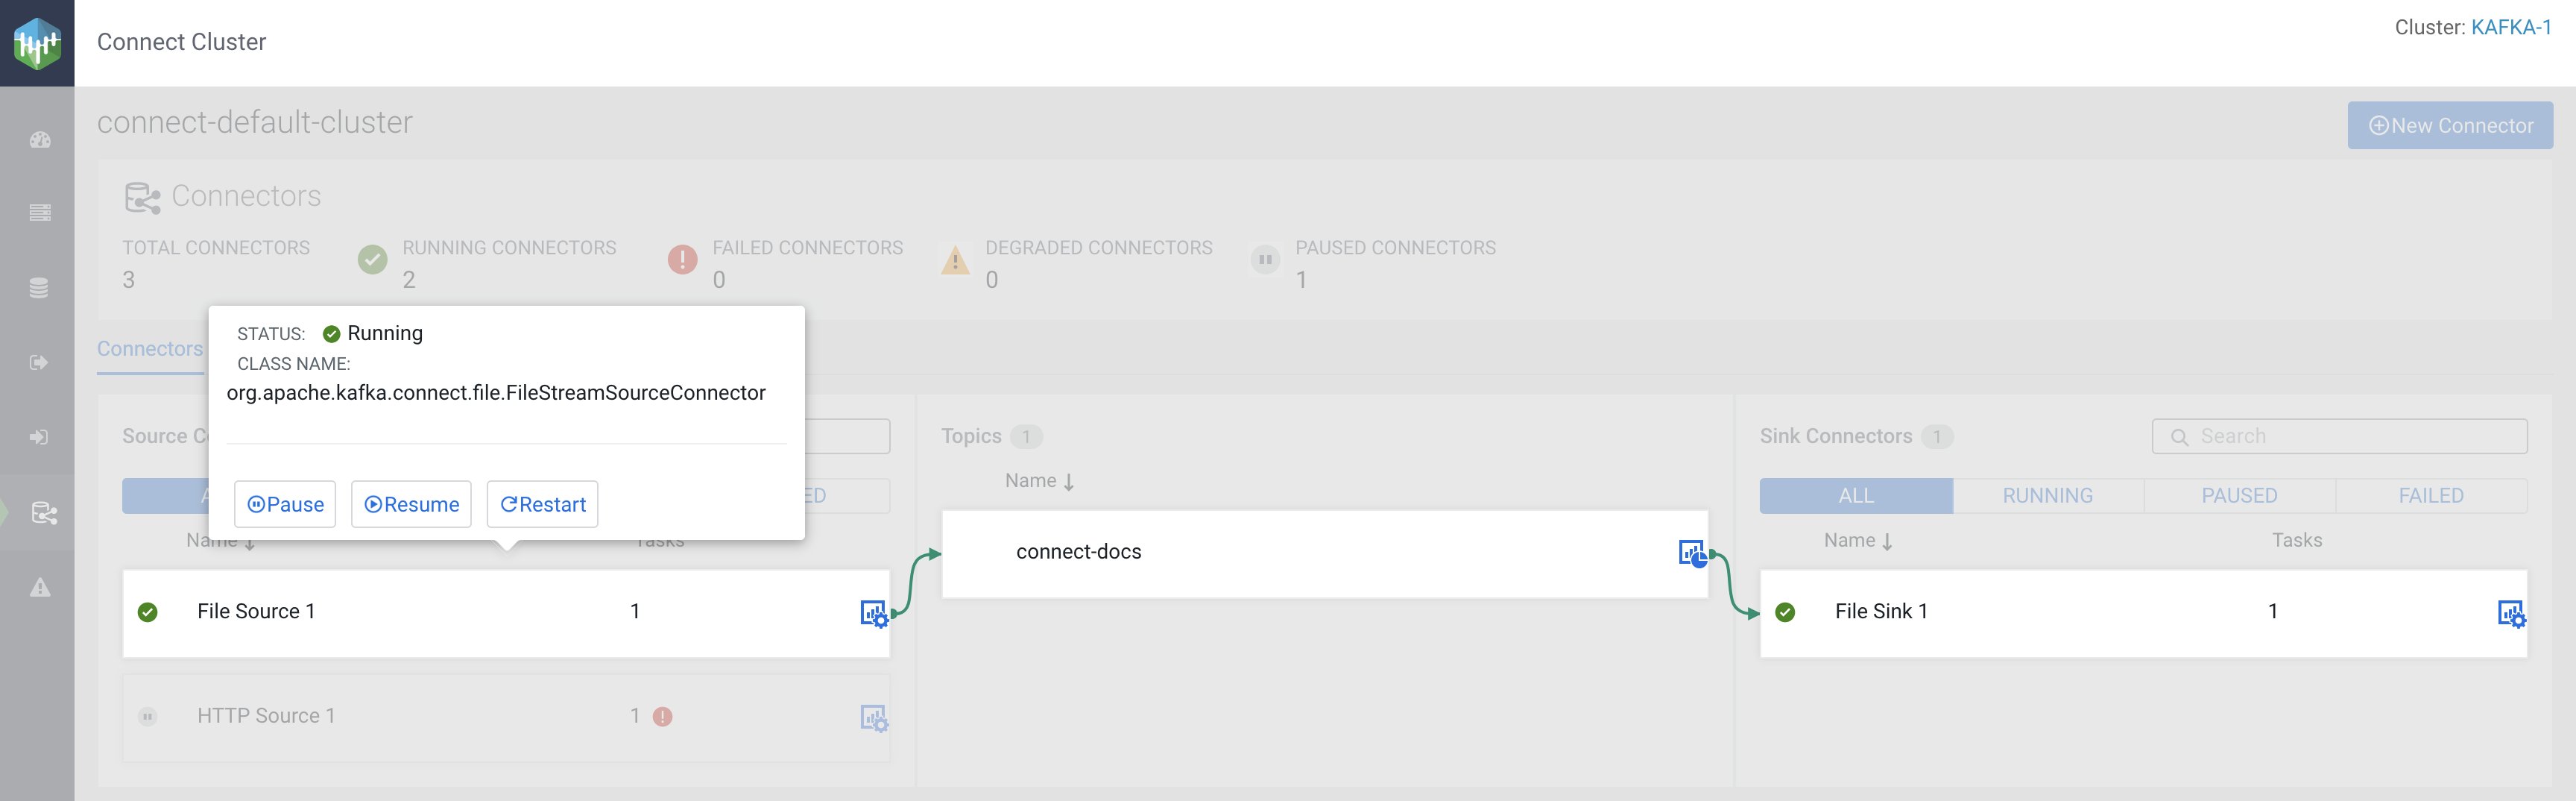
The Connector Profile
After you deploy a connector, you can monitor the details of the connector, modify its configuration, and carry out various management actions.
To monitor or manage a specific connector, click  (Connector Profile) next to the connector's name. Clicking the icon
redirects you to the Connector Profile page of the selected connector.
The Connector Profile page enables you to monitor the details of the
connector, monitor and manage its tasks, and edit its configuration. The page consists of
two tabs Connector Profile and Connector
Settings.
(Connector Profile) next to the connector's name. Clicking the icon
redirects you to the Connector Profile page of the selected connector.
The Connector Profile page enables you to monitor the details of the
connector, monitor and manage its tasks, and edit its configuration. The page consists of
two tabs Connector Profile and Connector
Settings.
Connector Profile tab
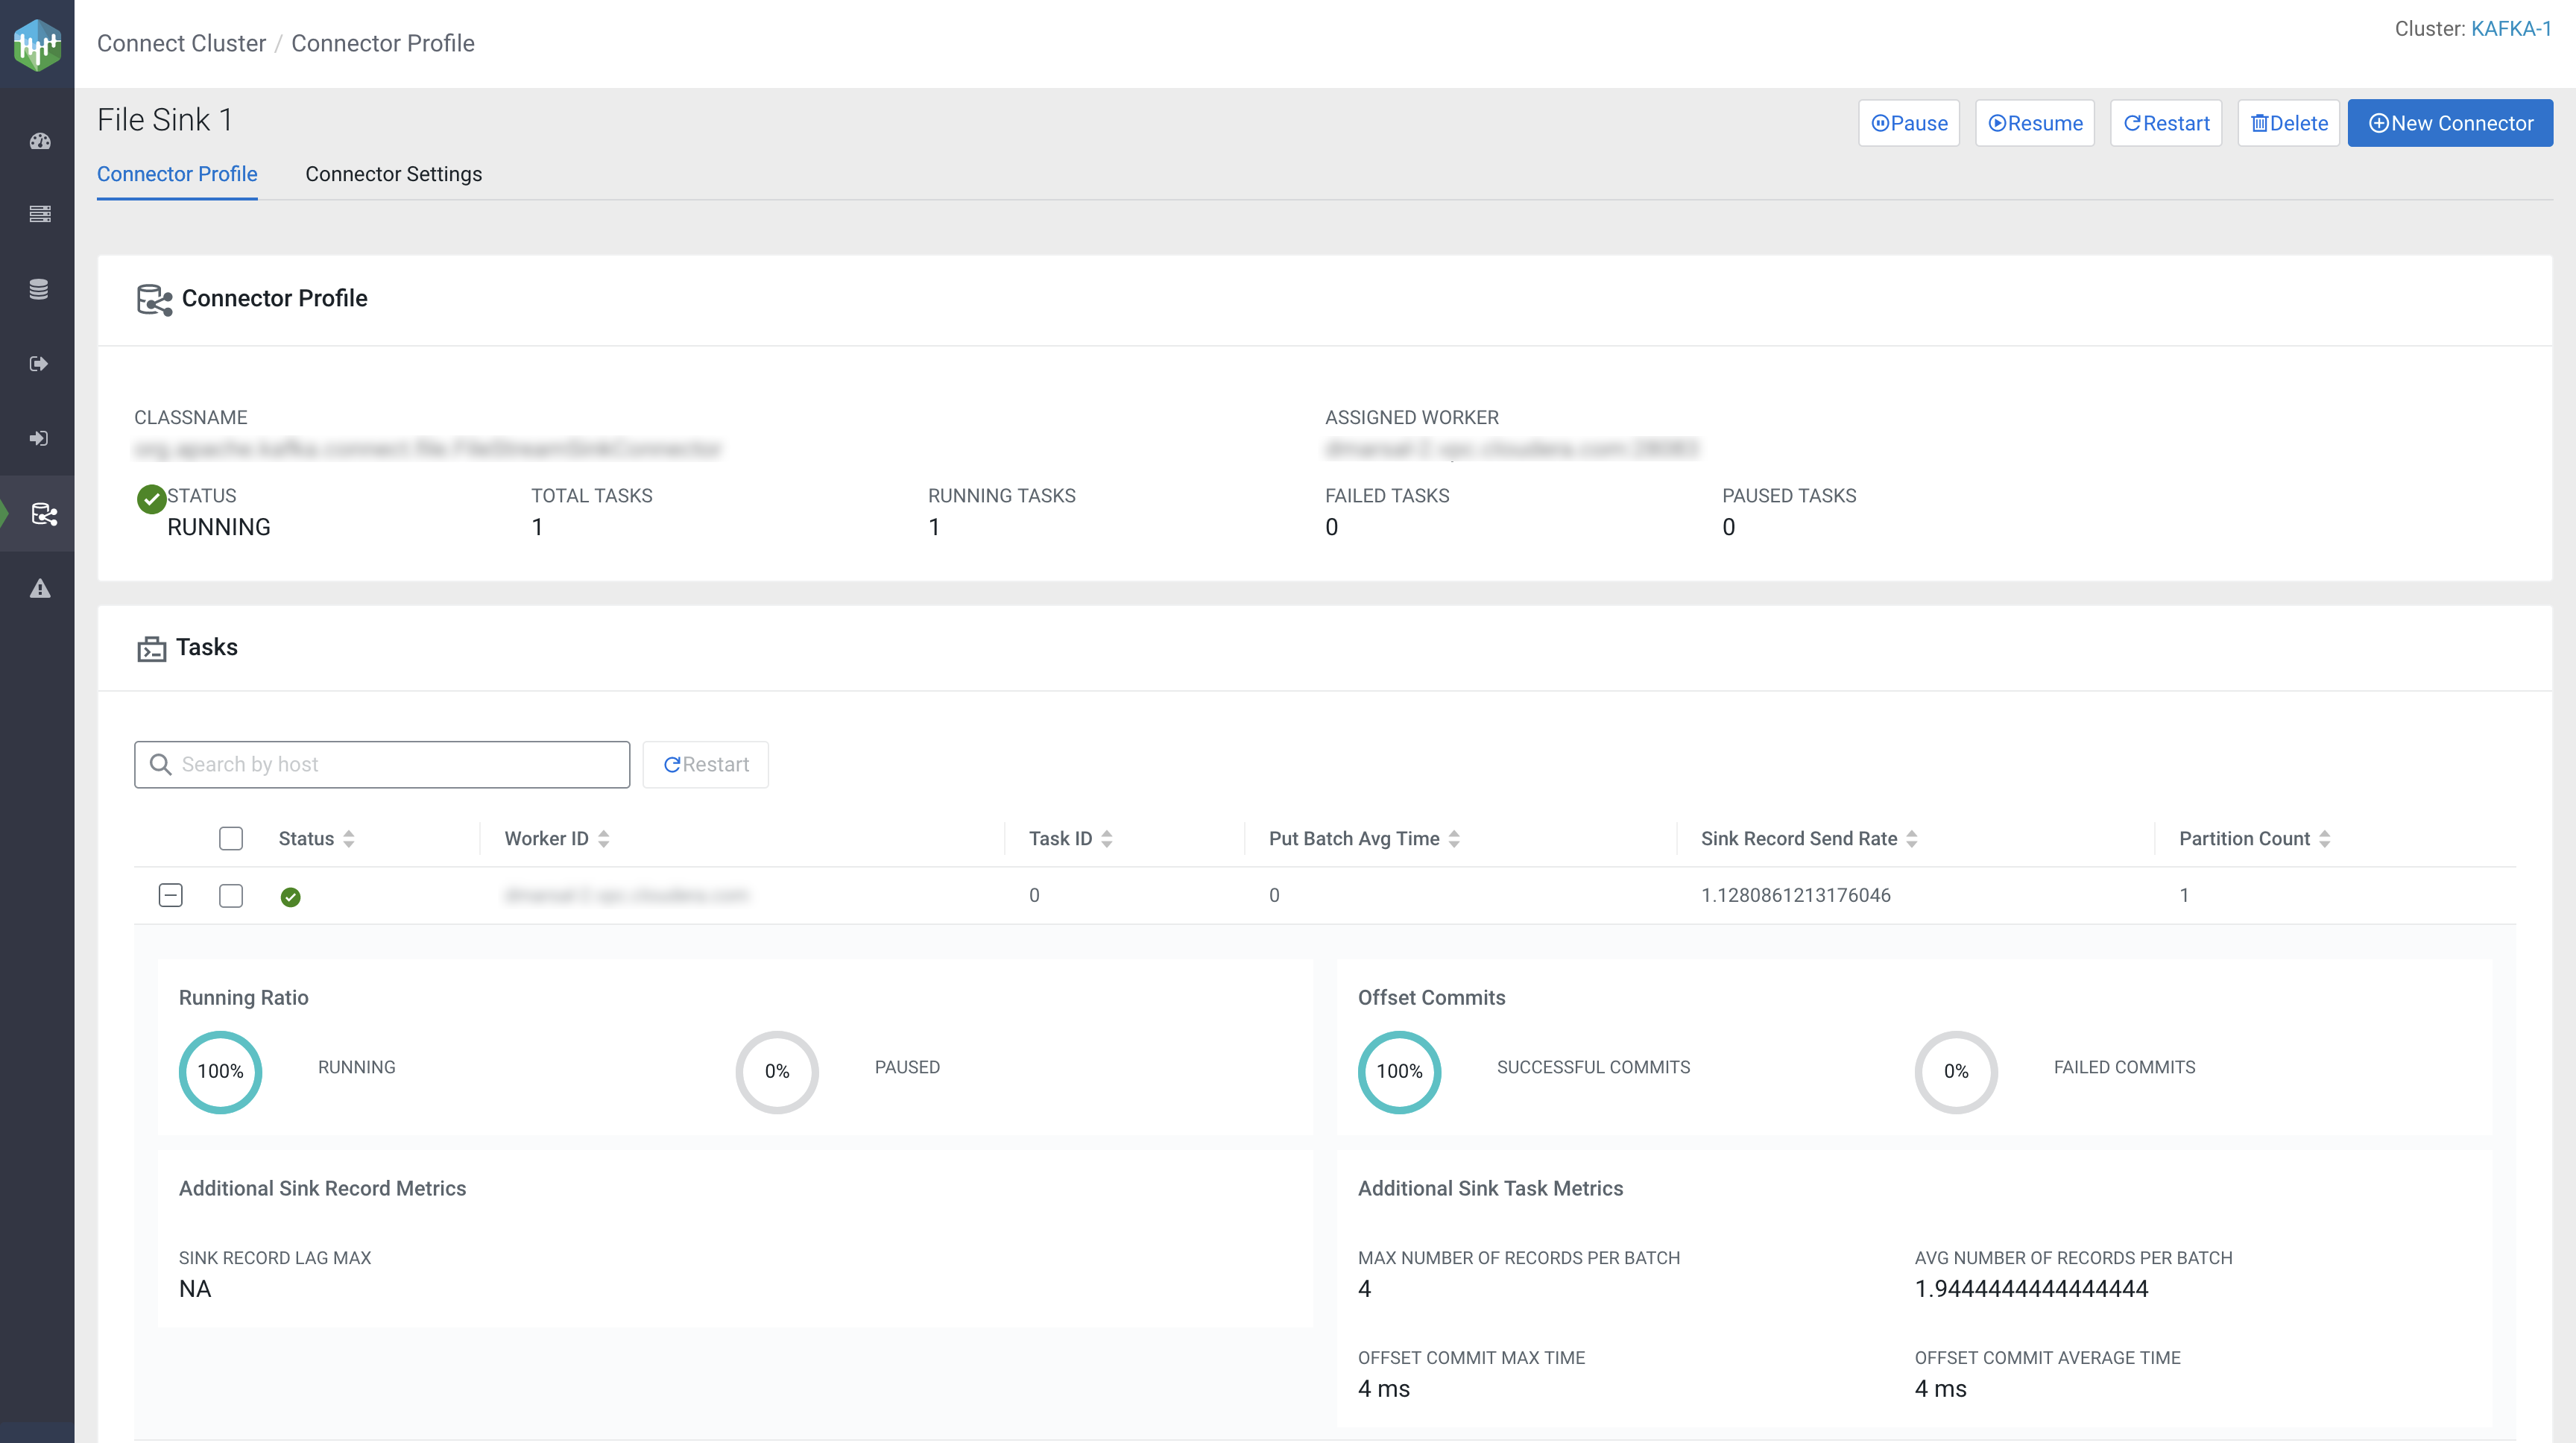
- The Connector Profile section provides you with details regarding the Classname, Assigned Worker, Status, Total Tasks, Running Tasks, Failed Tasks, and Paused Tasks.
- In the Tasks section, you can view and monitor Status, Worker ID,
Task ID, and various other details regarding connector tasks.
Clicking
next to a task displays
detailed information and metrics about the selected task. In addition to viewing
status and metrics, the Tasks section also allows you to restart
a particular task. This can be done by selecting the task you want to restart and
clicking the Restart option found within the
Tasks section. The Search by host option
enables you to search for particular task details by host. - Using the buttons in the top right-hand corner you can pause, resume, restart, and delete the connector, or deploy a new connector.
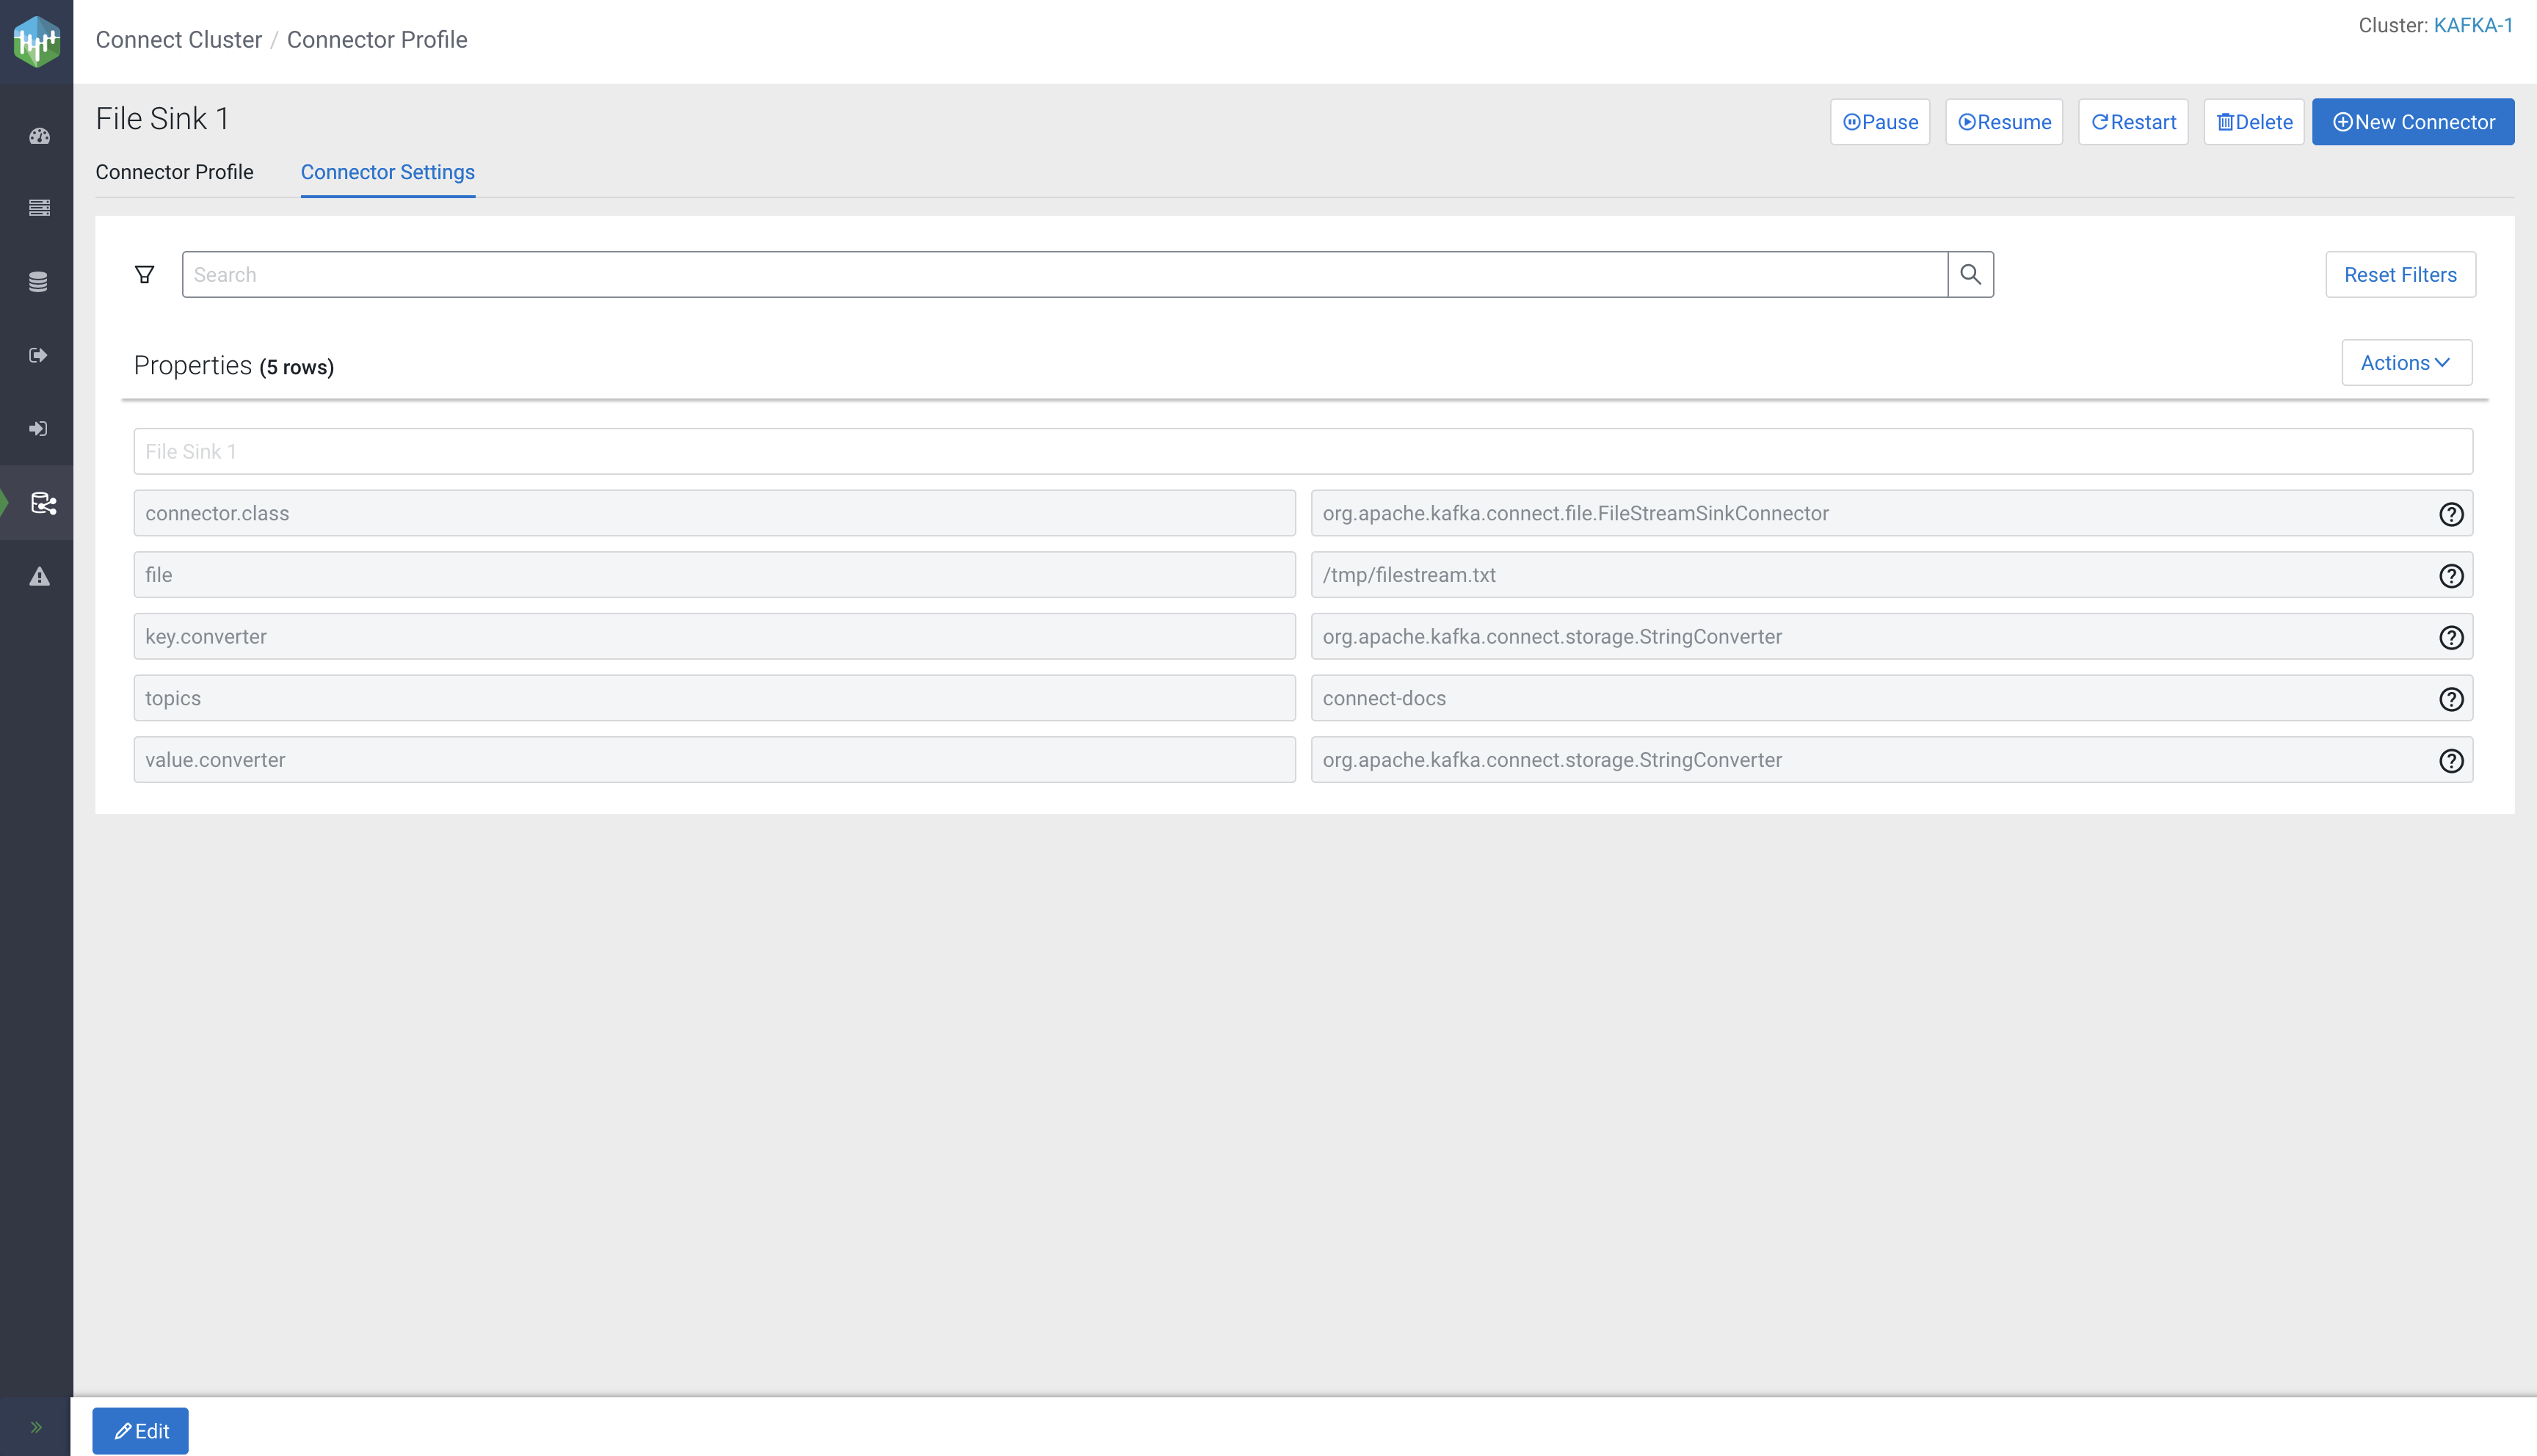
Connector Settings tab
 Edit in the bottom left-hand corner. In addition to
reconfiguring the connector, you can pause, resume, restart, and delete the connector, or
deploy a new connector with the buttons in the top right-hand corner of the page.
Edit in the bottom left-hand corner. In addition to
reconfiguring the connector, you can pause, resume, restart, and delete the connector, or
deploy a new connector with the buttons in the top right-hand corner of the page.