Monitoring lineage information
Learn how you can visualize the lineage between producers and consumers.
producer_1, as
shown in the following image: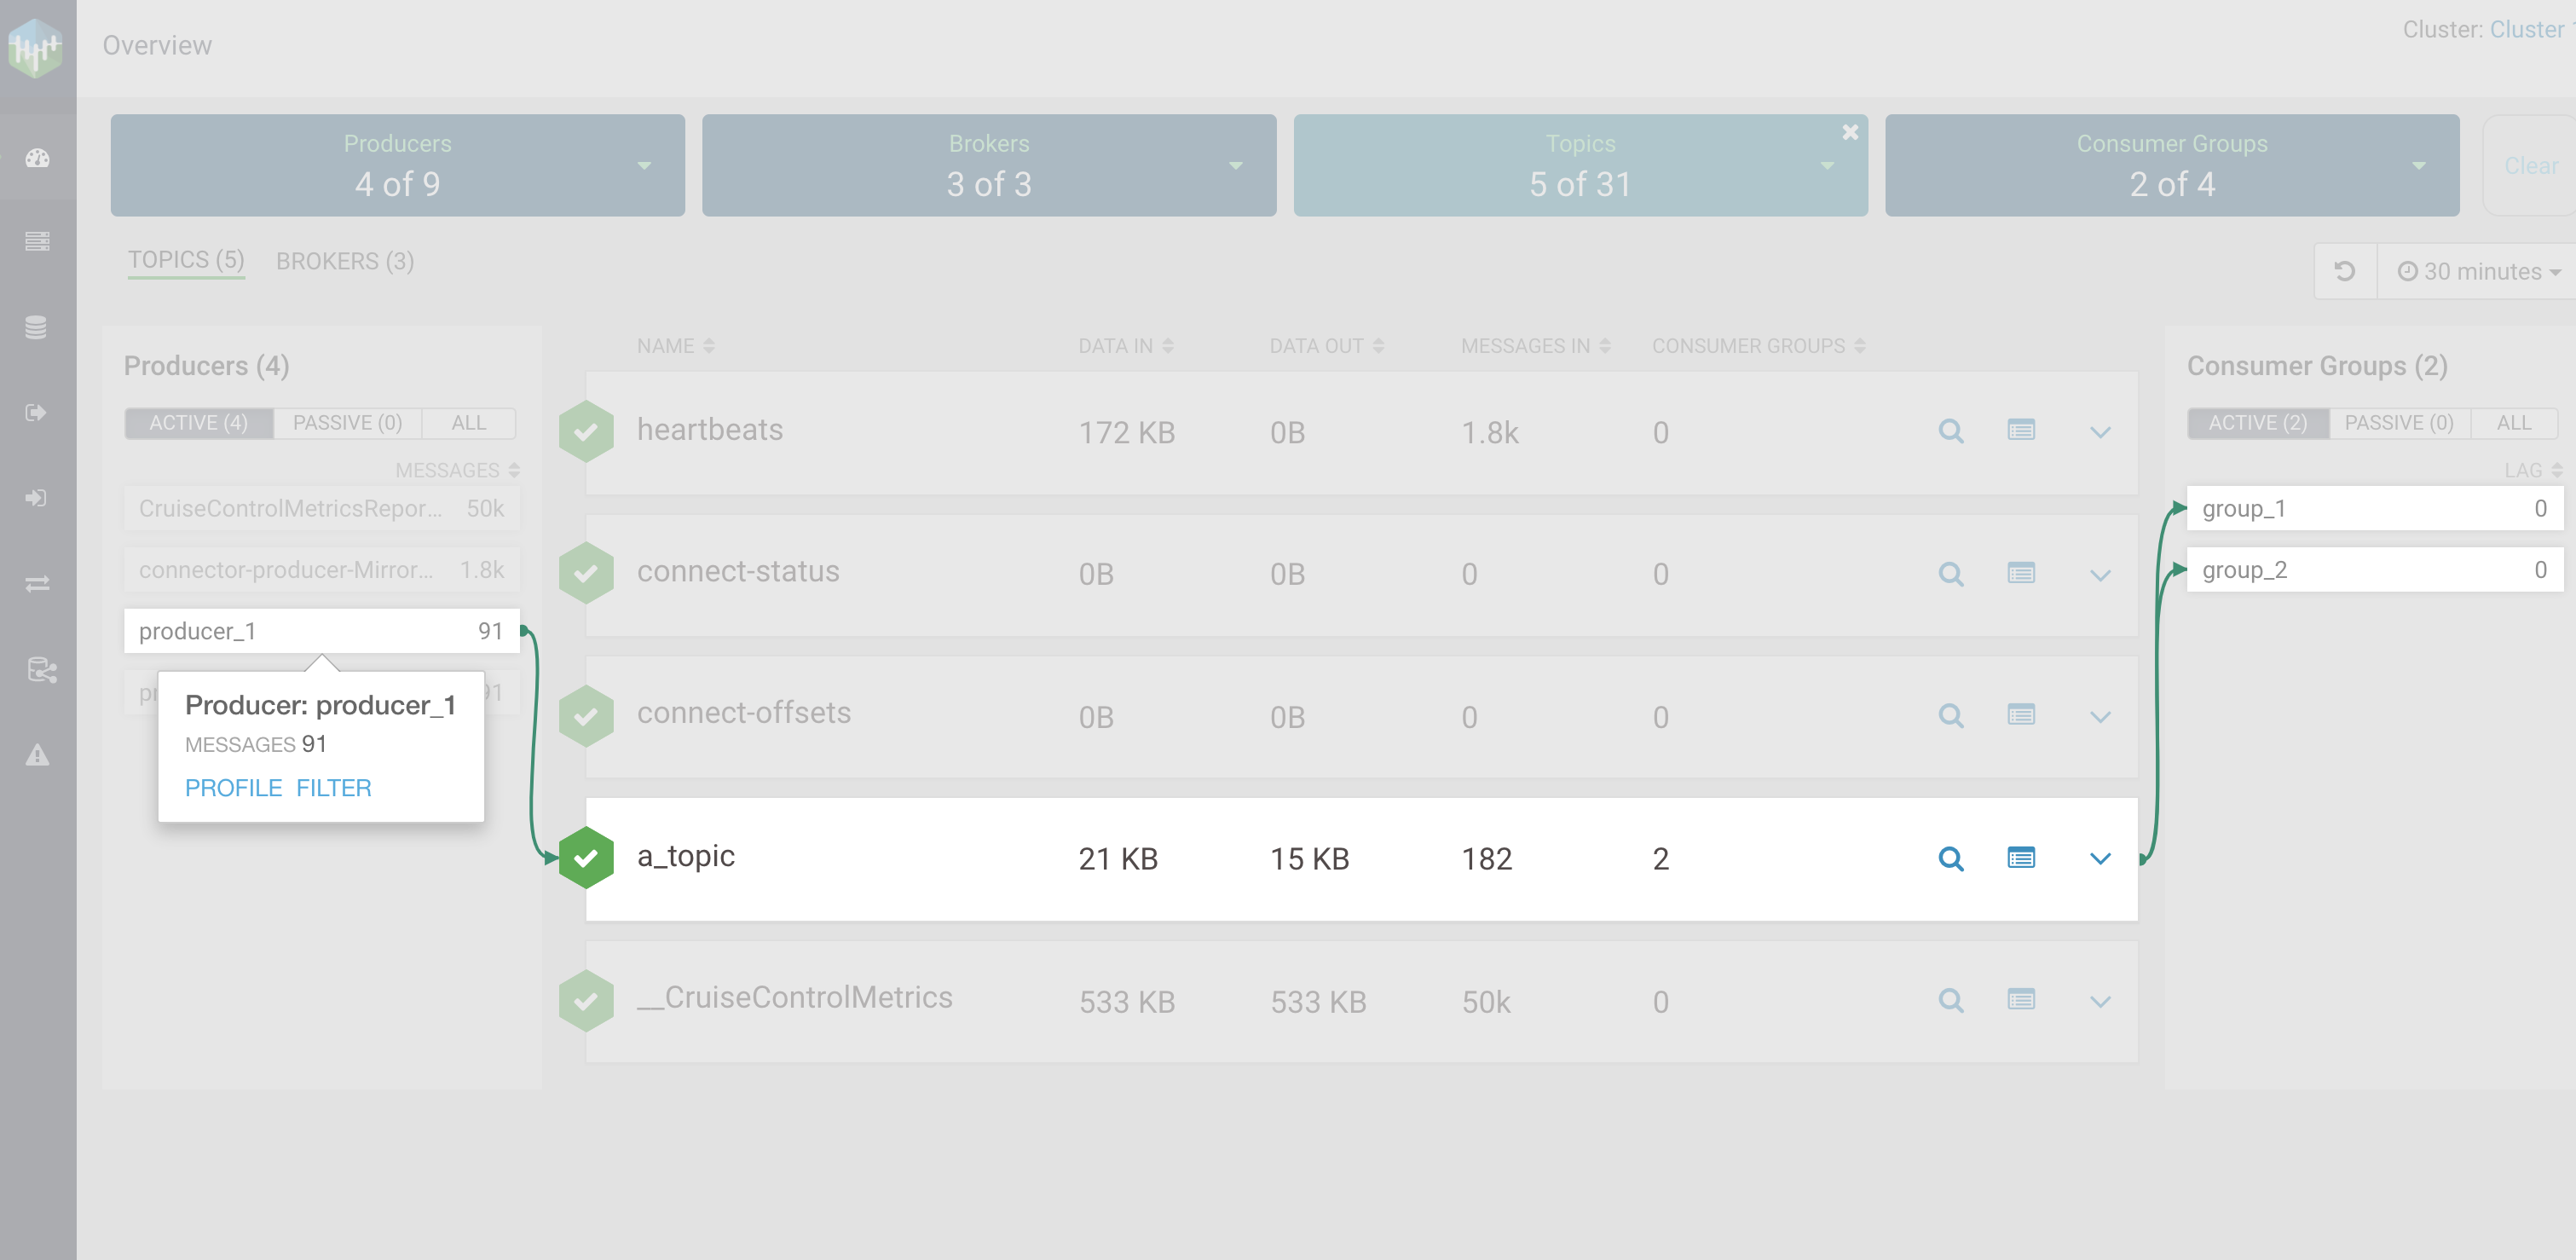
After you click producer_1, you can see that it produces to a topic
called a_topic, and that both consumer groups (group_1 and
group_2) consume from that topic.
group_1, as shown in the following image: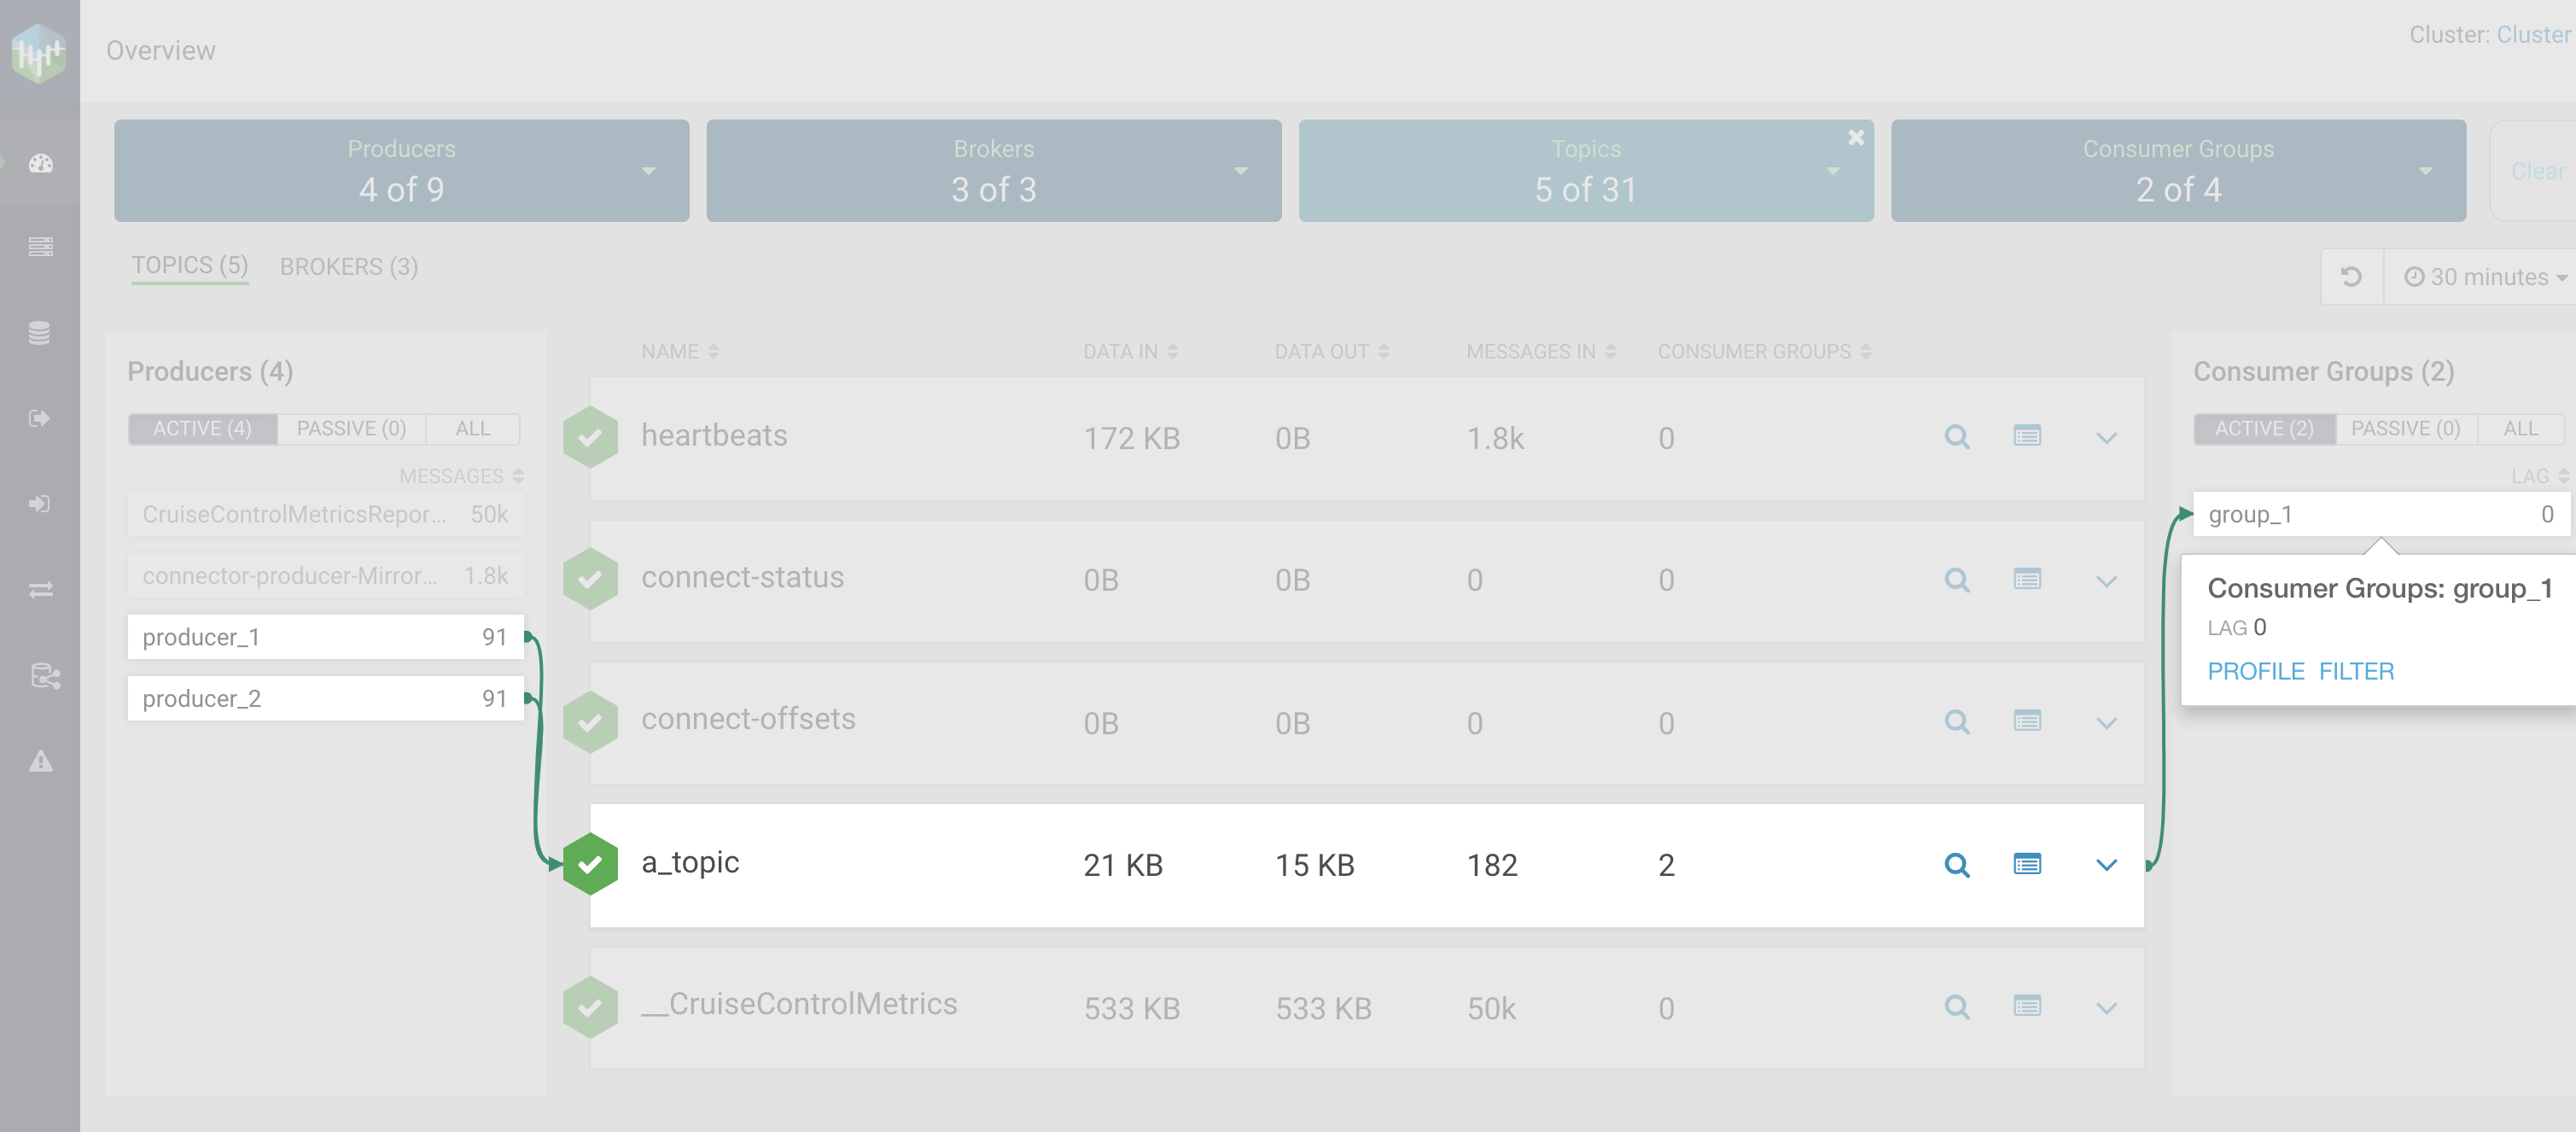
After you click group_1 consumer group, you can see that it consumes
from the topic called a_topic, and that two producers produce to that topic
(producer_1 and producer_2).
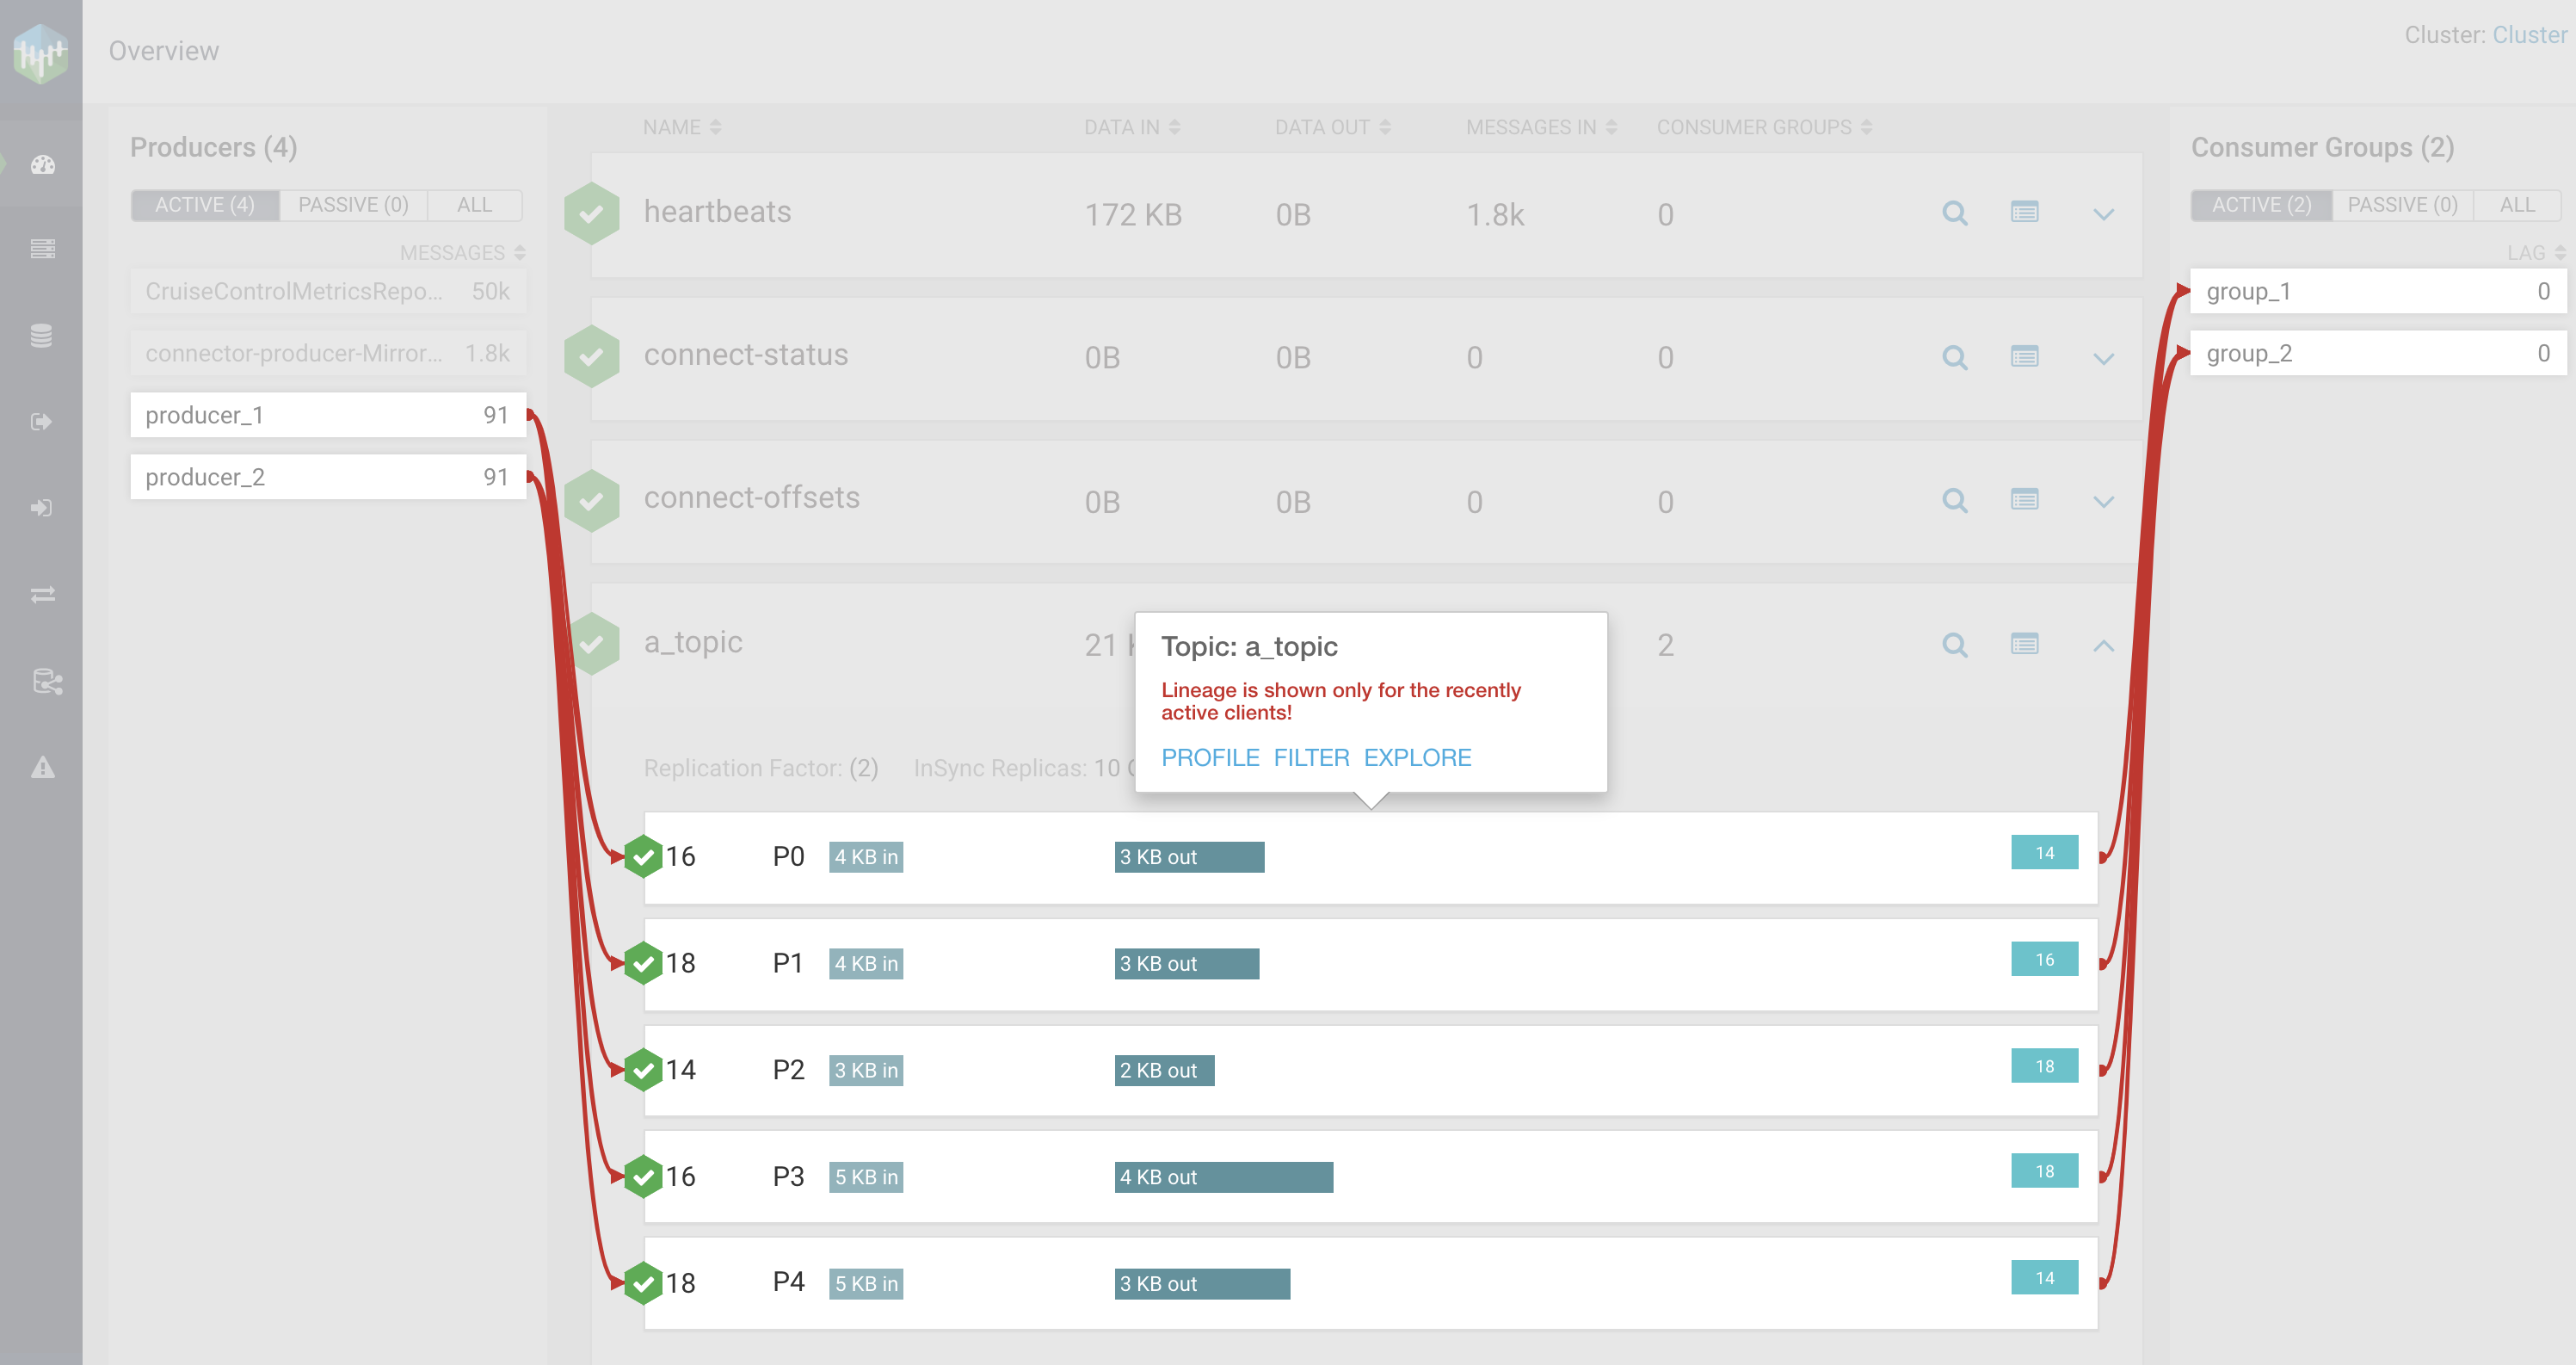
P3, as shown in the following image: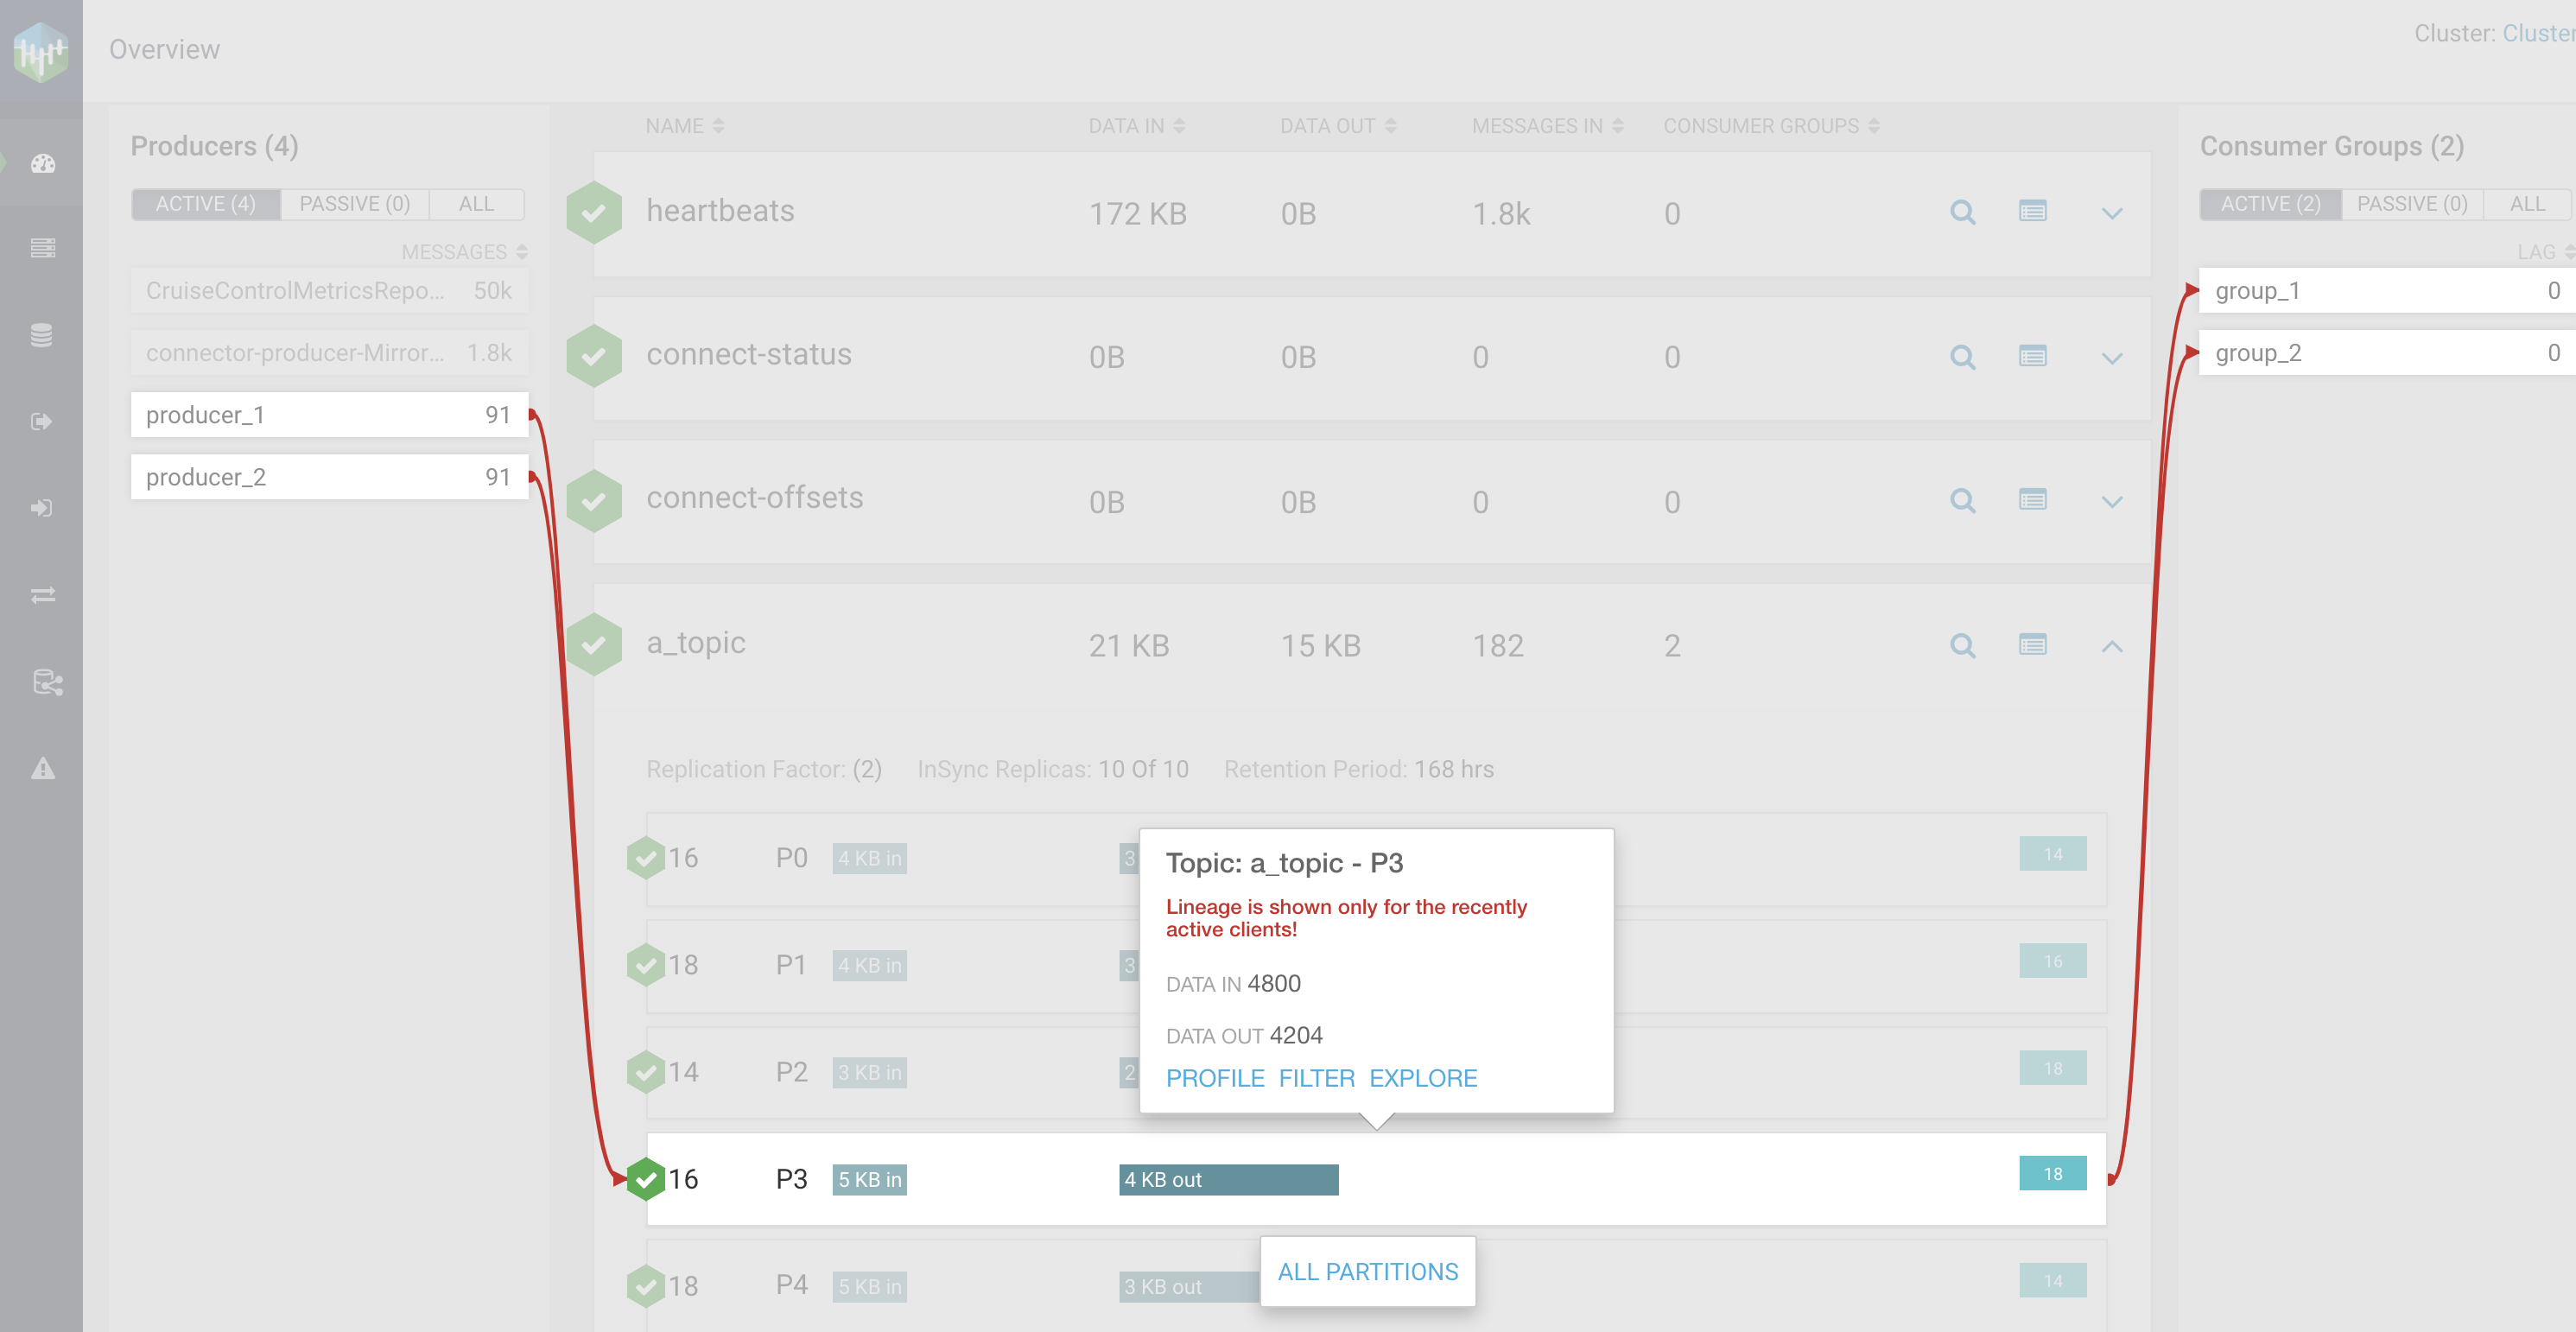
After you click P3 partition in the topic called
a_topic, you can see that producer_1 and
producer_2 produce to that partition, and group_1 and
group_2 consume from it.
You can also access the lineage information from the experimental endpoints. You can find the endpoints at the Streams Messaging Manager REST API Reference.