What's New in Cloudera Manager
Learn about the new features and changed behavior of Cloudera Manager in Cloudera Manager 7.13.3 and its cumulative hotfixes.
You must be aware of the additional functionalities and improvements to features of Cloudera Manager in Cloudera Manager 7.13.3 and its cumulative hotfixes. Learn how the new features and improvements benefit you.
Cloudera Manager 7.13.3 introduces new features and includes all cumulative hotfixes from 7.13.2.100 through 7.13.2.20000. For a comprehensive record of all updates in Cloudera Manager 7.13.2.x, see What's New in Cloudera Manager 7.13.2.x.
Cloudera Manager 7.13.3.0
- System and Security Improvements - Upgraded logging framework to Apache Log4j 2
-
Cloudera Manager now utilizes Apache Log4j 2 for internal logging and system communications, replacing the legacy Reload4J framework. This architectural upgrade eliminates false-positive security vulnerability reports and provides modern logging capabilities. For configuration migration steps and file path changes, see Cloudera Manager upgrades the internal logging framework to Apache Log4j 2.
- New REST API support for Configuration Change Auditing
-
Cloudera Manager now introduces a dedicated Representational State Transfer (REST) Application Programming Interface (API) endpoint that retrieves configuration audit history programmatically:
GET /api/v58/audits/configChangesExternal security, compliance, and Security Information and Event Management (SIEM) systems can now query structured configuration change records across clusters, services, roles, and Role Config Groups without manually aggregating raw audit events.
- Key Capabilities and Enhancements
-
-
Granular Audit Details: Exposes who changed a setting, the change timestamp, the revision ID, the affected cluster, service, or role, and the previous and new configuration values.
-
Flexible Filtering: Supports exact-match filtering by cluster name, service name, configuration parameter name, and specific revision ID point lookups.
-
Advanced FIQL Expressions: Supports Feed Item Query Language (FIQL) operators to query by username, role, source (API or Admin Console), and configuration parameters using asterisk (*) wildcard syntax.
-
Revision-Level Pagination: Paginates results by complete revision units rather than individual records, which prevents configuration changes from fragmenting across API pages.
-
Role-Based Security: Controls access through the AUTH_AUDITS authority (granted to ROLE_ADMIN and ROLE_AUDITOR) and automatically redacts sensitive parameter values, matching the behavior in the Config History user interface.
For more information about request parameters, pagination, and query examples, see Configuration Change Audit API.
-
- Load balancer support for Livy for Spark 3
-
The Livy for Spark 3 service now has a Livy Load Balancer Address property (
livy.lb.uri). When you place a load balancer, such as HAProxy, in front of several Livy for Spark 3 service instances, set this property to the client-facing URL of the load balancer on every instance. Cloudera Manager passes the address to each Livy Server role and adds the load balancer principal to the Livy keytabs when you regenerate them, so that every instance accepts requests and Kerberos authentication for the load balancer hostname. For more information, see Livy load balancing with HAProxyLivy load balancing with HAProxy. - Livy version in the Host Inspector
-
The Host Inspector now shows the Livy and Livy for Spark 3 versions together with the versions of the other Cloudera Runtime components. To view them, go to , and then click Show Inspector Results.
- Health check monitoring for HiveServer2 query compilation
-
Cloudera Manager now monitors HiveServer2 query compilation performance by tracking the
hive_waiting_compile_opsmetric. When threads waiting to compile queries reach configured thresholds, Cloudera Manager raises health alerts on HiveServer2 roles:- CONCERNING health status: Raised when the CONCERNING threshold is reached
- BAD health status: Raised when the BAD threshold is reached
You can configure the CONCERNING and BAD threshold values separately for your environment.
If you experience frequent health alerts, increase the hive.driver.parallel.compilation.global.limit configuration value (default: 5) to allow more concurrent query compilations.
To configure thresholds:
- In Cloudera Manager, navigate to .
- Search for
HiveServer2 Waiting Compile Operations Thresholds. - Set the Warning threshold (CONCERNING state) and Critical threshold (BAD state) values:
Figure 1. Compilation thresholds and parallelism settings 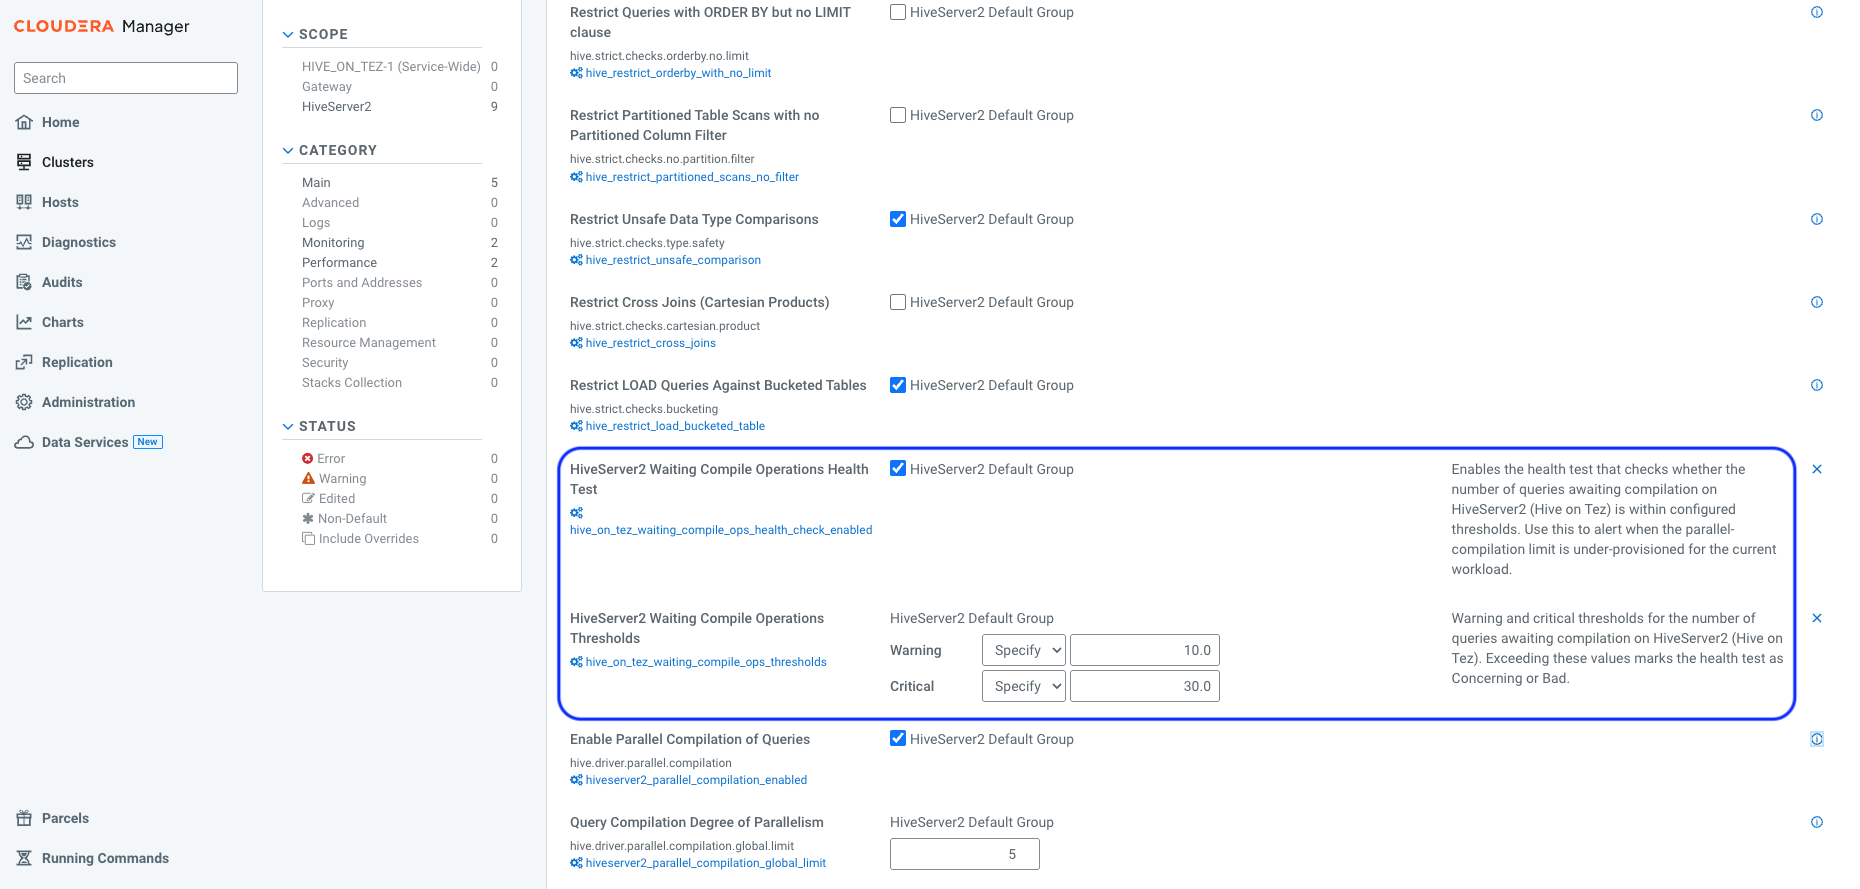
Default values: Warning threshold is 10.0 queries, Critical threshold is 30.0 queries. The Query Compilation Degree of Parallelism defaults to 5.
- Optionally, increase the Query Compilation Degree of Parallelism value to allow more concurrent query compilations.
Health check displays: Health check results are displayed on the HiveServer2 role page.
Figure 2. Normal status 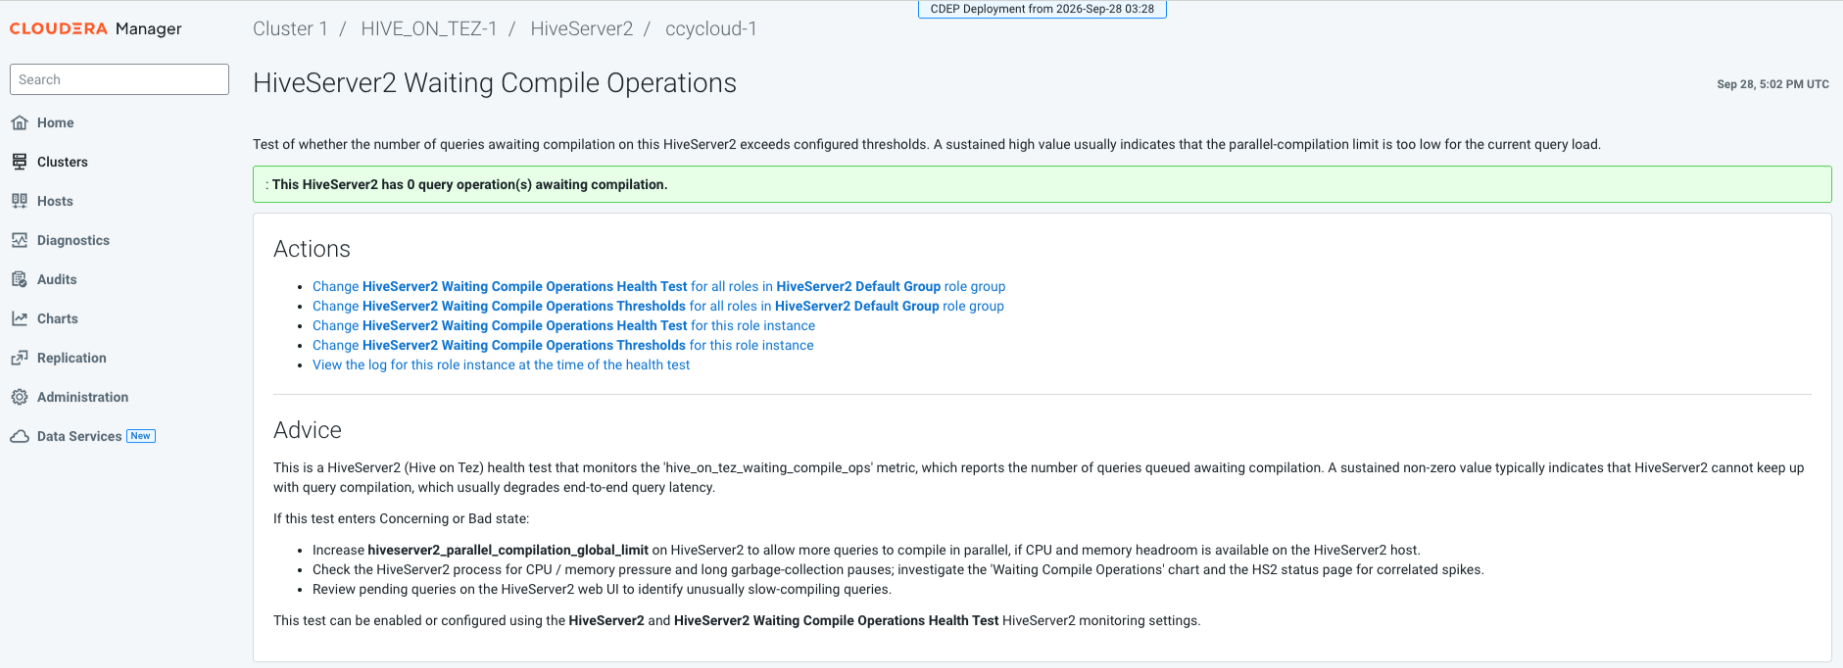
When no queries are waiting for compilation, the health test shows green status with 0 operations awaiting compilation.
Figure 3. CONCERNING status 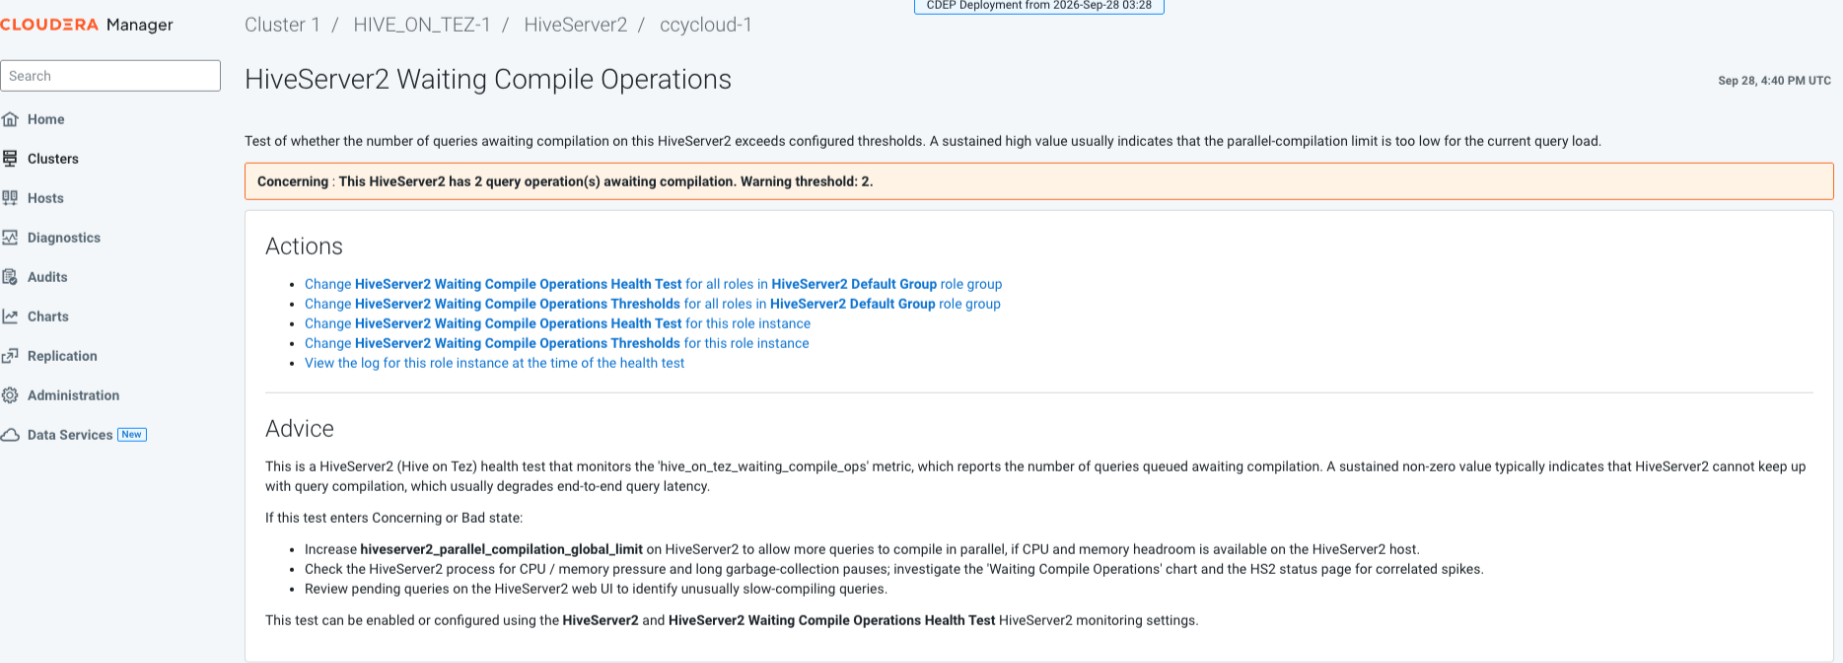
When queries exceed the warning threshold, the health test shows orange status. A sustained high value indicates that the parallel-compilation limit is too low for the current query load.