Tracking profiler jobs in Compute cluster enabled environments
In Profilers, you can see the status and statistics of your profilers.
Under , you can have an overview of your profiler since their launch and some basic information of the last jobs. Use this page to quickly check if your profiler jobs are failing.
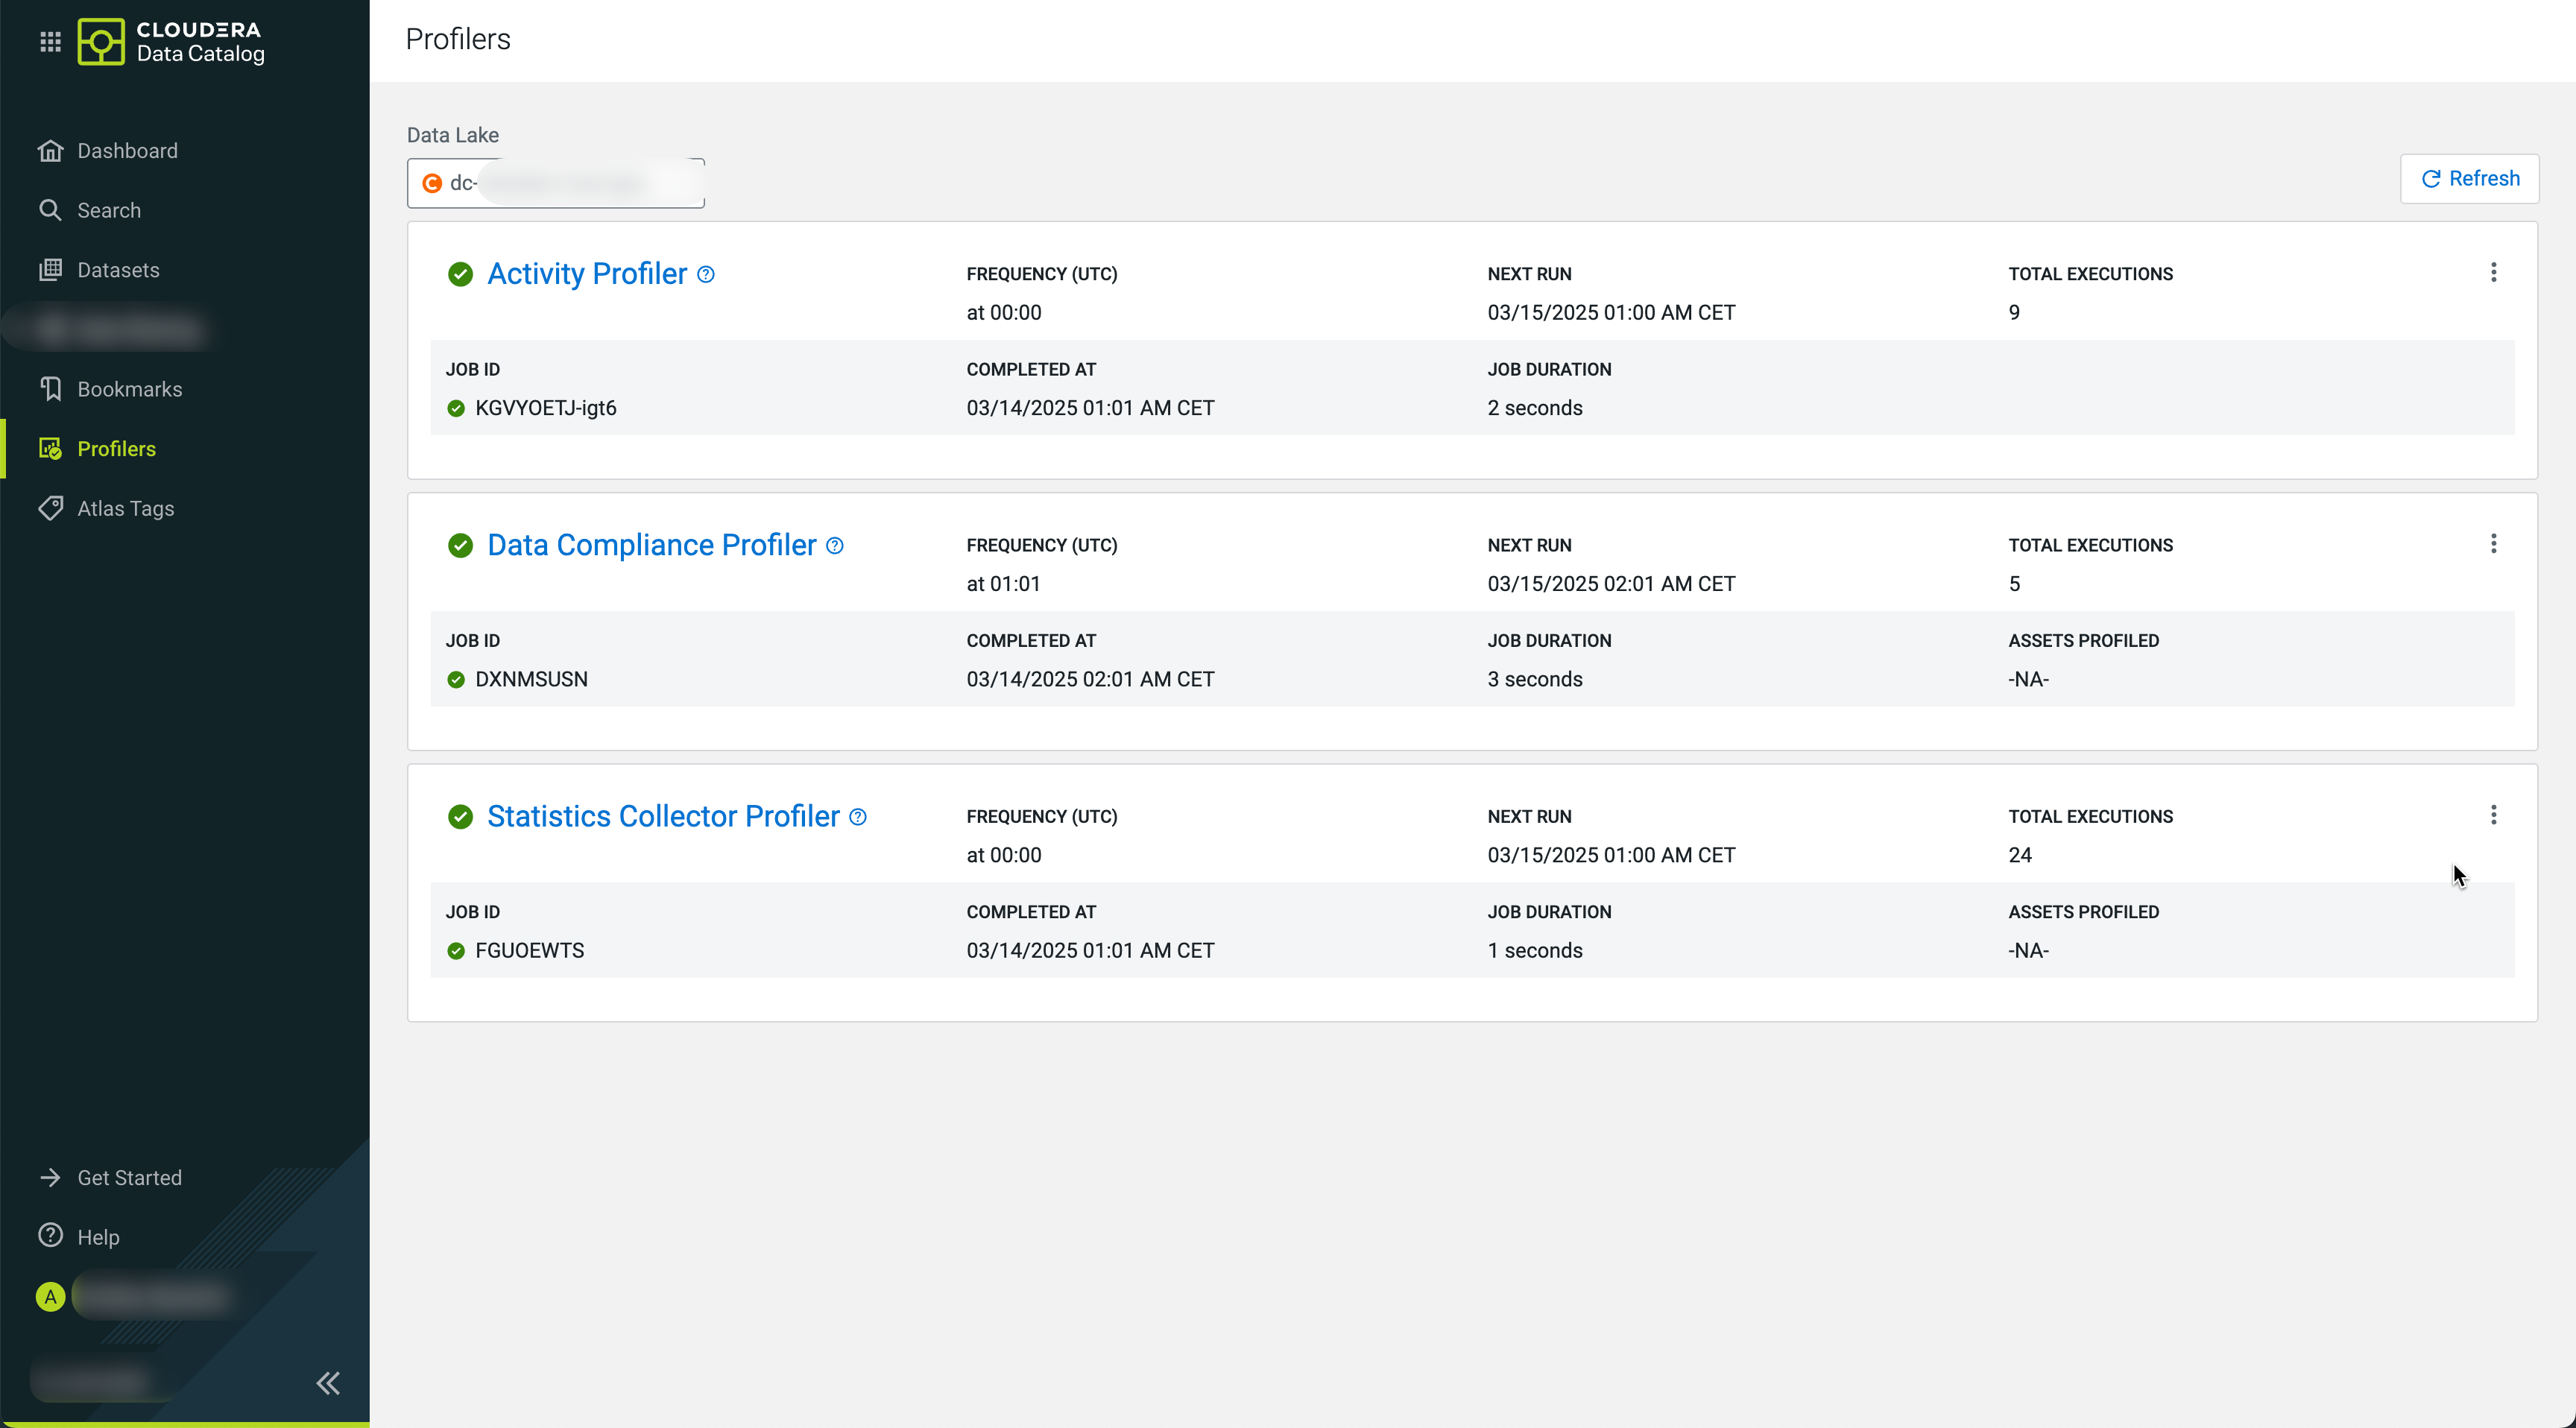
For each profiler, you can view the details about:
- Profiler type
- Profiler Status for the last job (as an
icon
 ,
, ,
,  )
) - Frequency (UTC)
- Next Run (in your local timezone)
- Total Executions (since the launch of the profiler)
- Job status is
marked with icons (,, )
- Running (Successfully launched)
- Paused
- Creation in Progress
- JOB ID of the last job
- COMPLETED AT
- JOB DURATION (of the last job)
- ASSETS PROFILED (by the last job)
Using this data can help you to troubleshoot failed jobs or even understand how the assets were profiled and other pertinent information that can help you to manage your profiled assets.
Click  >Details to gain more information
about your profiler jobs in .
>Details to gain more information
about your profiler jobs in .
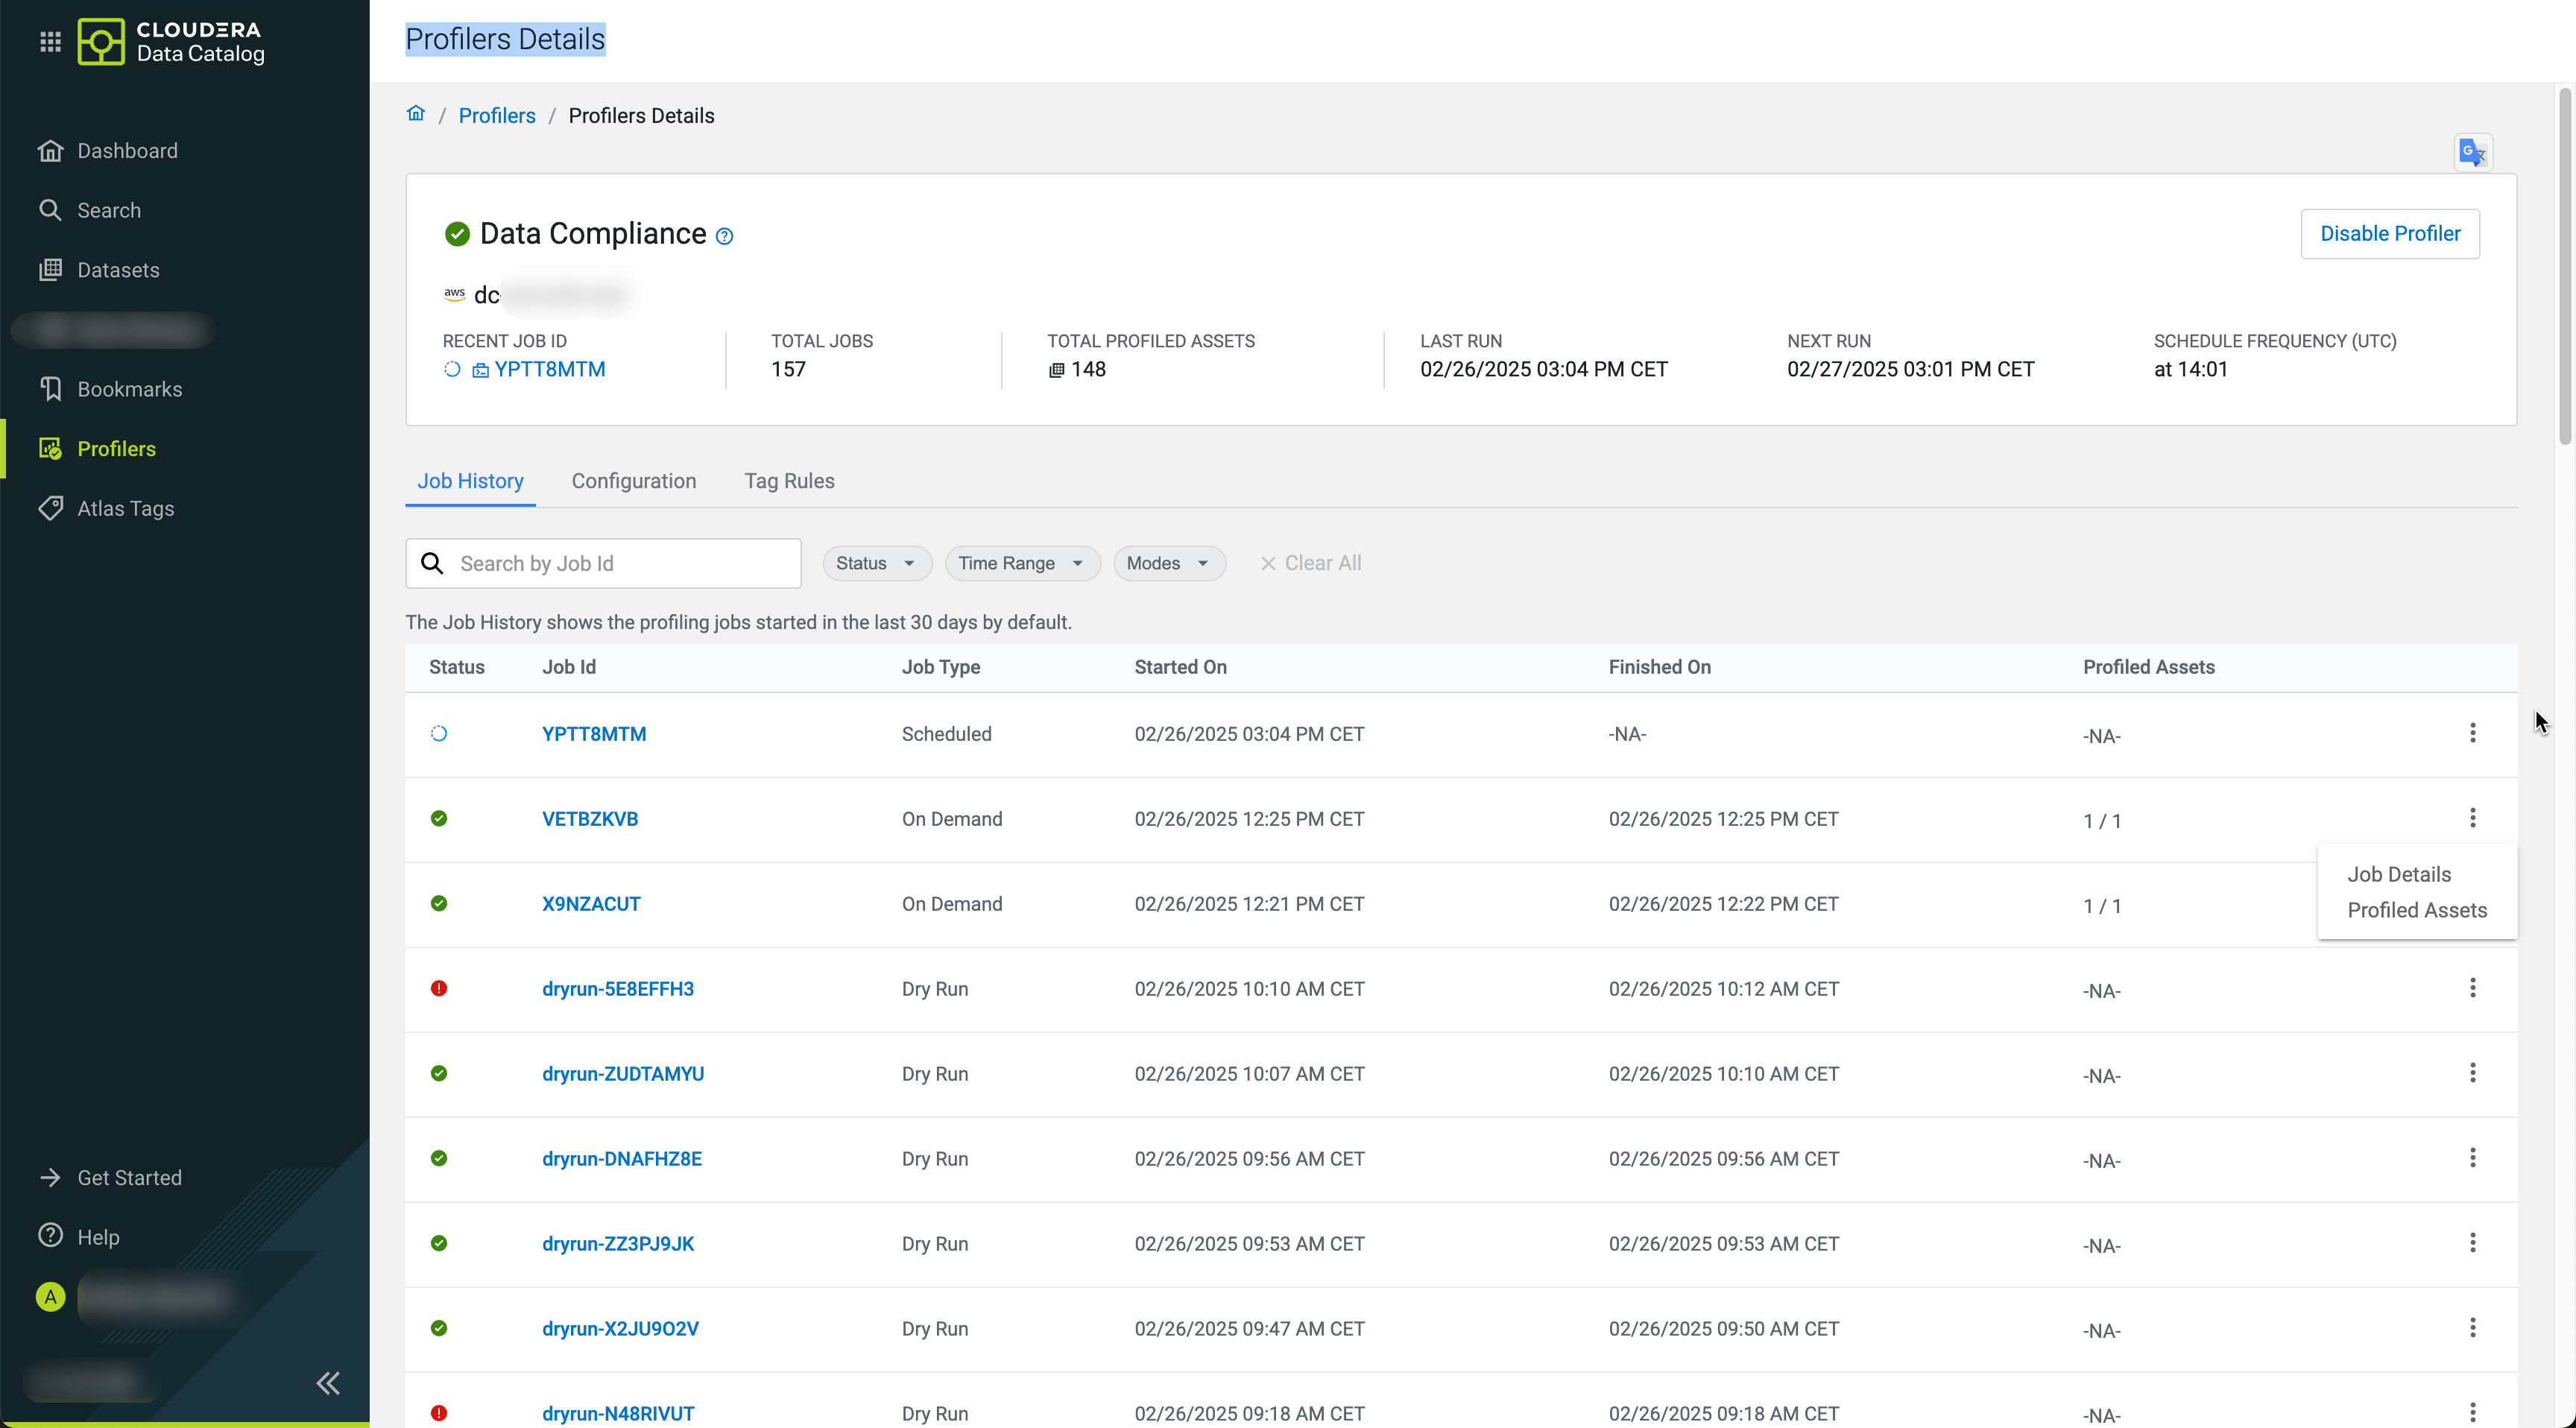
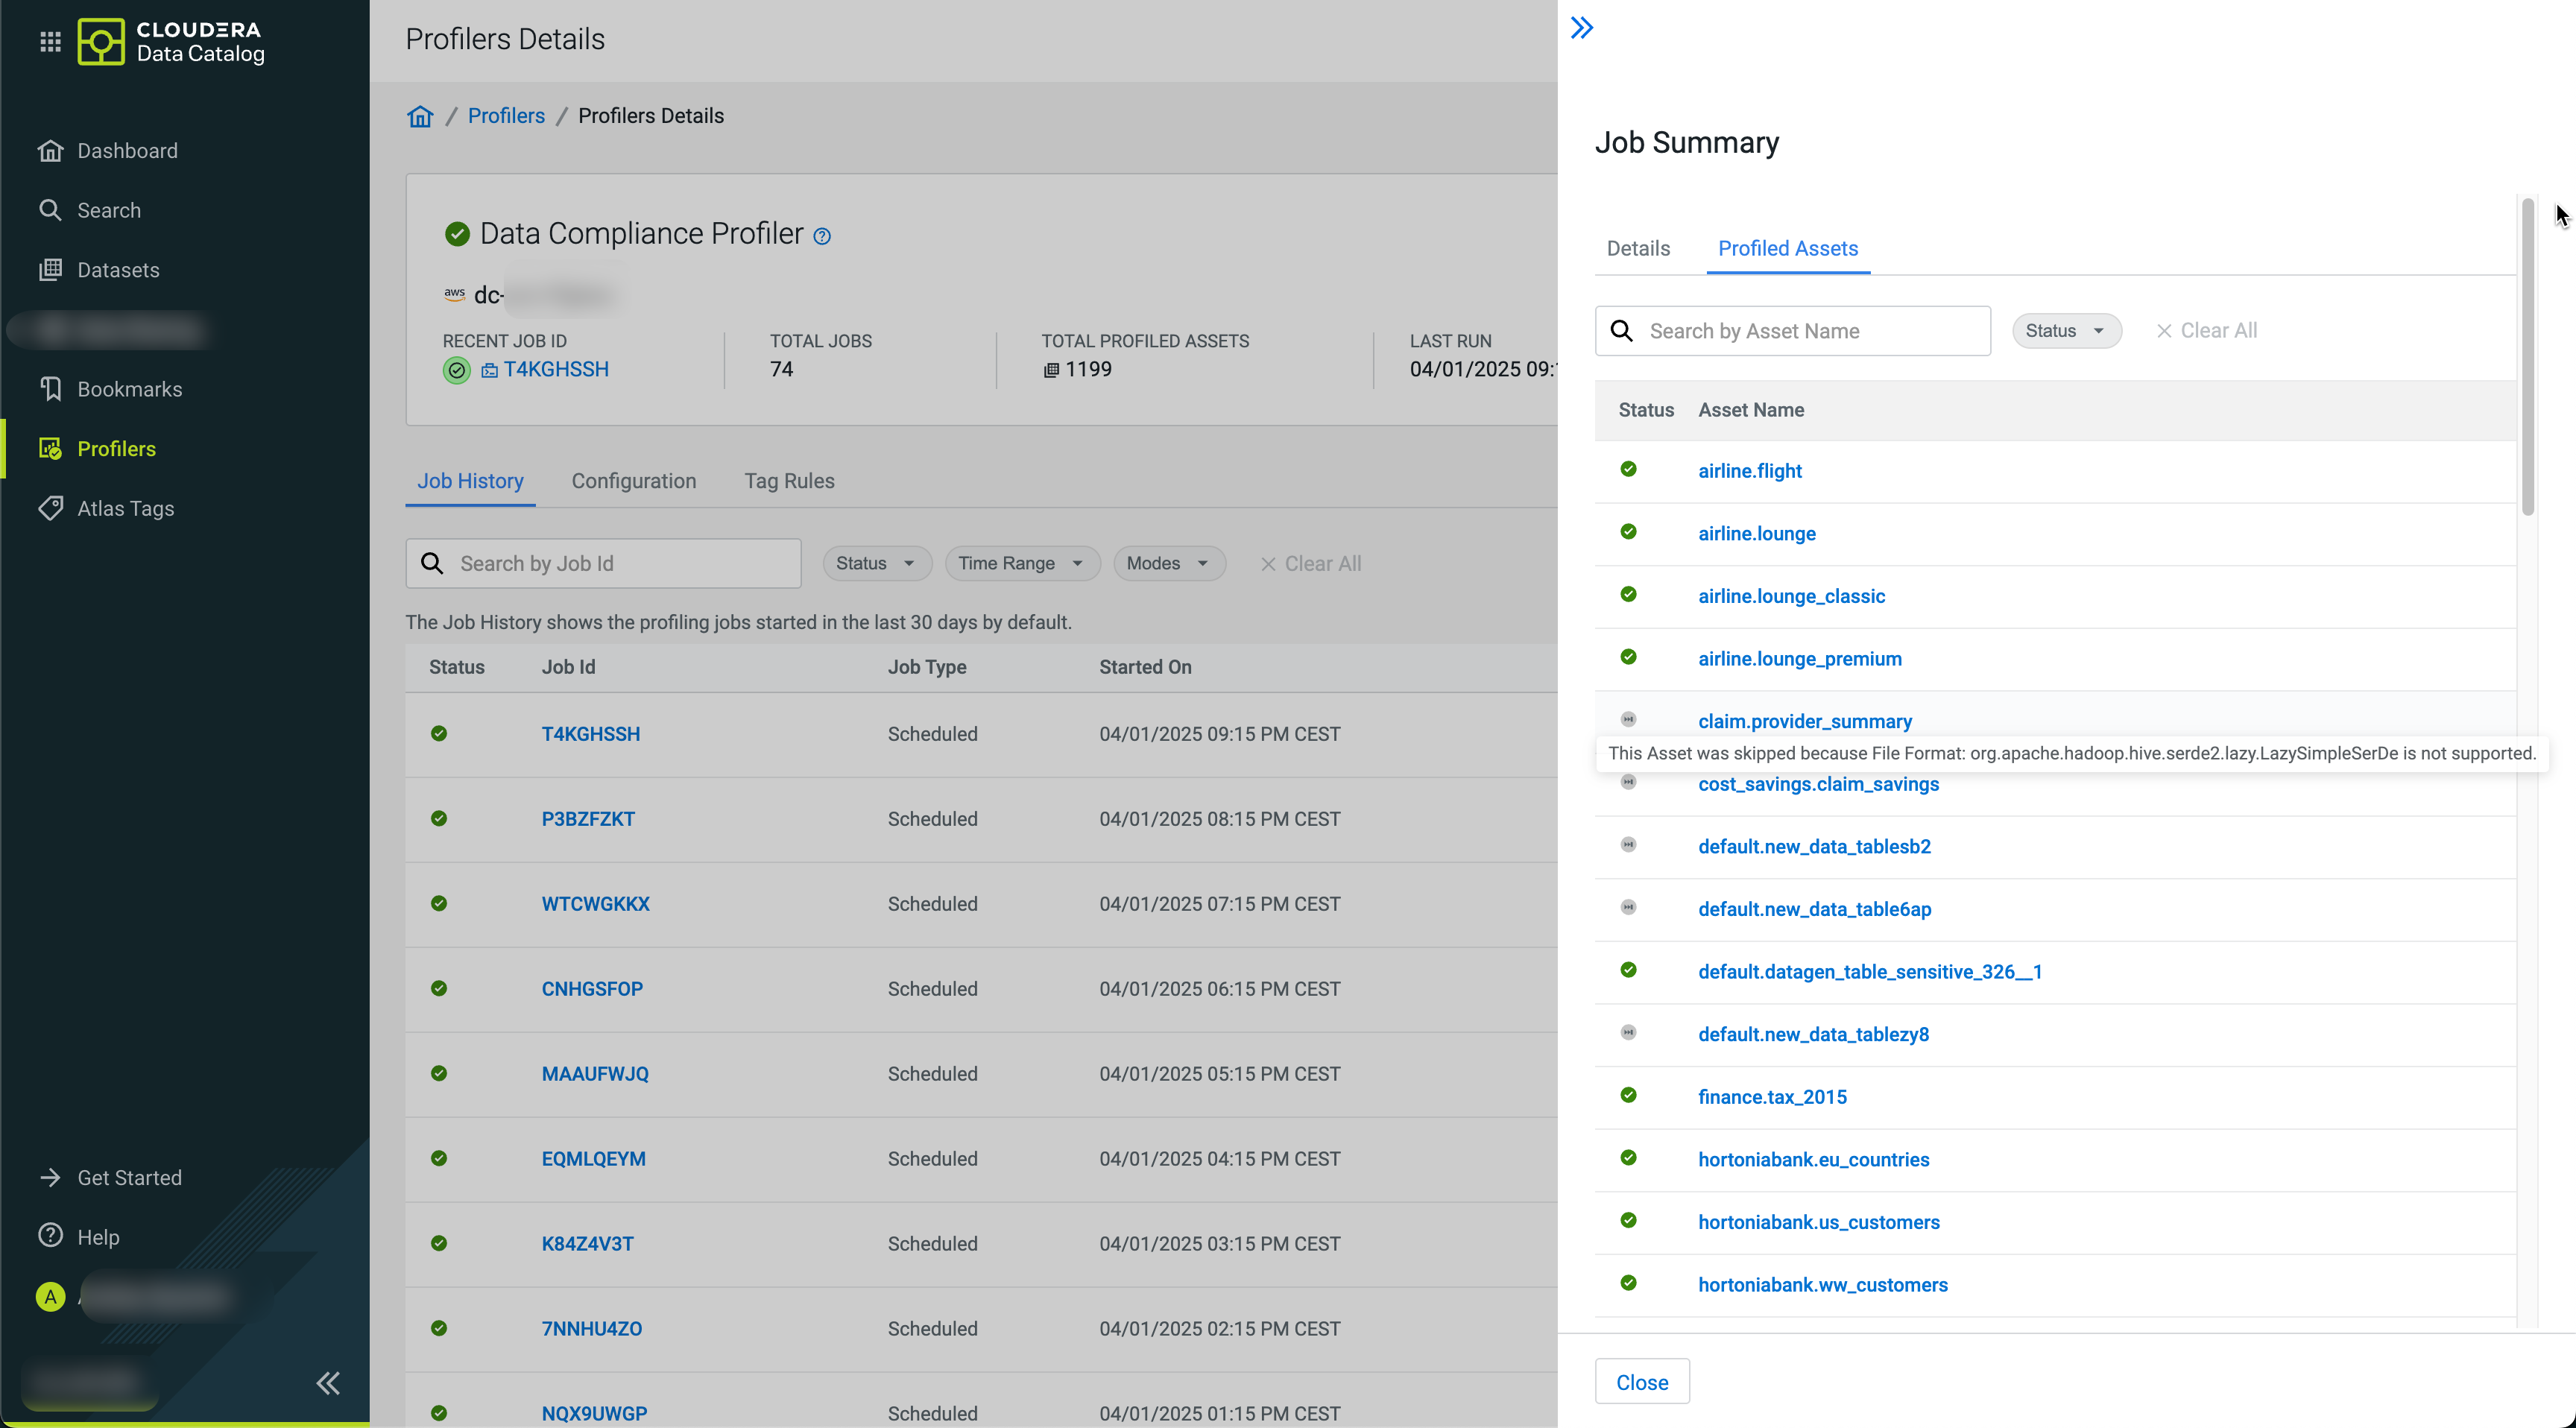
By clicking by the individual jobs in Profilers
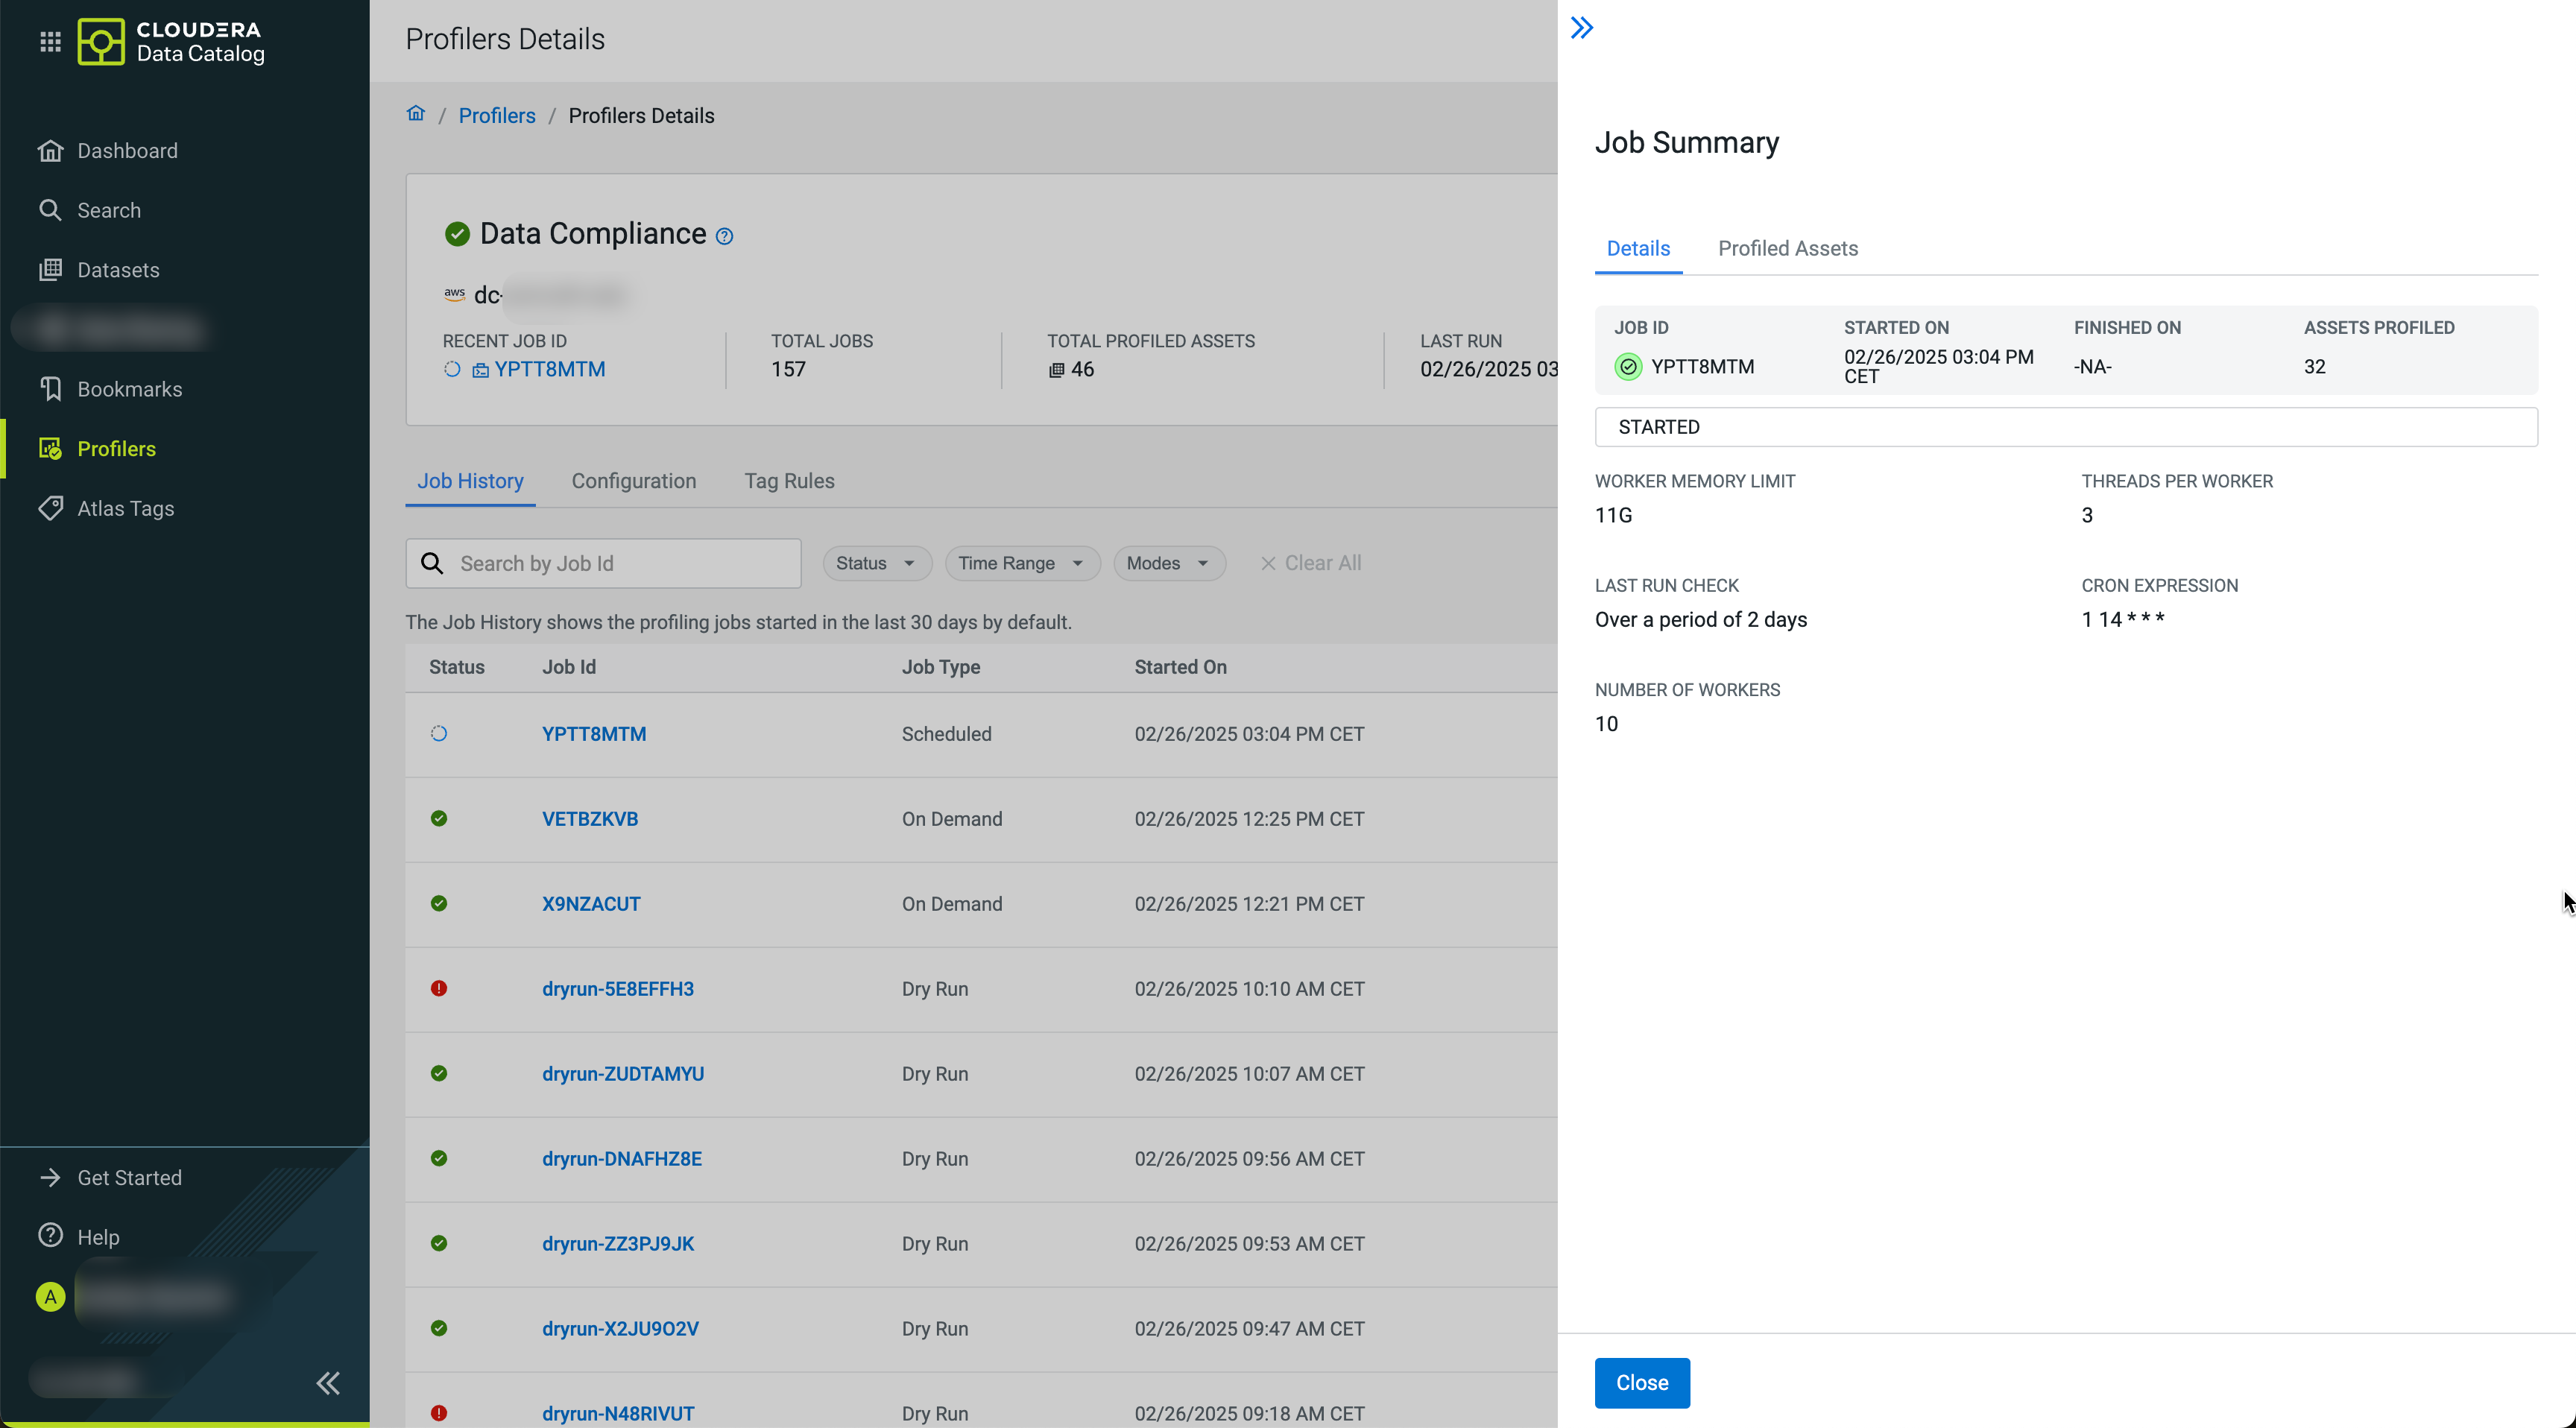
Details, you can drill further down to Job Summary
and Profiled Assets.
The Job Summary shows you the specific configuration applied for that particular job run.
The Profiled Assets not only gives you a list of entities that were selected by your profiler to be profiled, but it let's you filter them.