
View Grafana dashboards
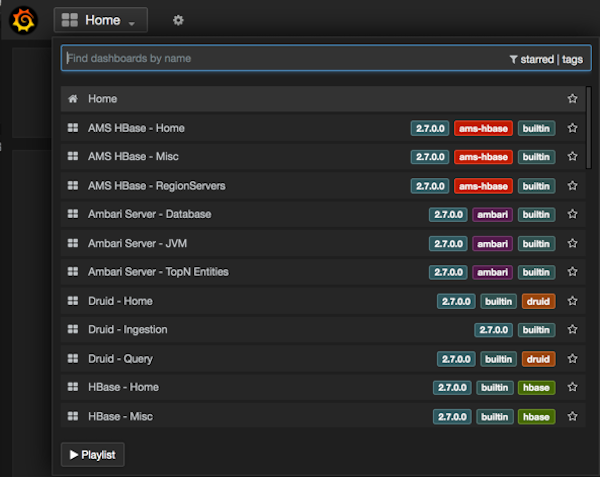
Use Dashboards on the Grafana home page to access AMS, Ambari server, Druid and HBase metrics.
-
To see more available dashboards, click the Home list.
-
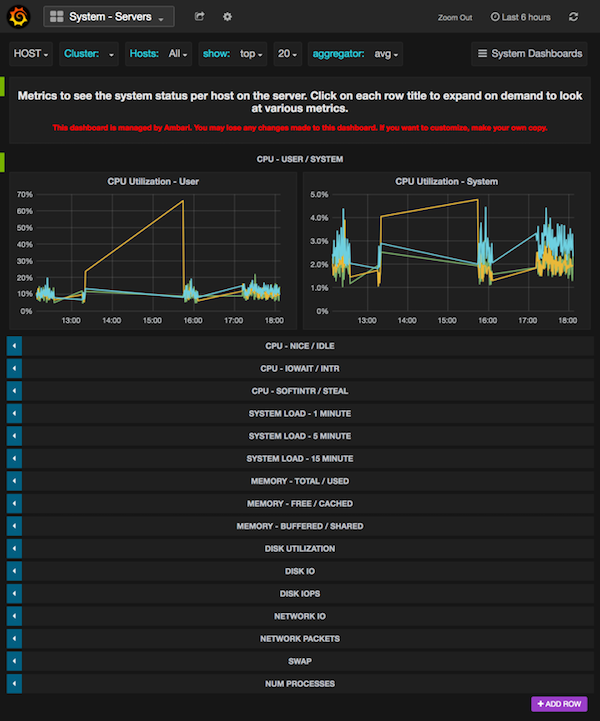
From the list on Home, click a dashboard name..
For example, click System - Servers.The System - Servers dashboard opens.